Best Smart Scale for Body Fat? 15 Reviewed (One Clear Winner)
Summarized from peer-reviewed research indexed in PubMed. See citations below.
Traditional bathroom scales miss the critical distinction between metabolically healthy individuals with higher muscle mass and those with harmful visceral fat accumulation that drives insulin resistance regardless of total body weight. The RENPHO MorphoScan Nova at $199 provides 8-electrode segmental analysis with hand grips measuring arms, legs, and trunk separately, reducing algorithm-dependent error by 15-25% versus foot-only designs while the rechargeable color LCD handle displays 50 measurements without smartphone requirement. Research comparing smart scales to DEXA imaging shows excellent weight accuracy at 0-0.3 kg median error across all models but 2.2-4.4 kg body composition variance, with measurement precision decreasing significantly at higher BMI levels where accuracy matters most for metabolic disease screening. Budget-conscious users achieve reliable trend tracking with the GE Smart Scale at $79 offering 8-electrode technology with 50 body composition measurements and Bluetooth connectivity matching premium functionality at one-third the price. Here’s what the published research shows about bioelectrical impedance validation, segmental measurement advantages, and evidence-based smart scale selection for accurate body composition monitoring.
Disclosure: We may earn a commission from links on this page at no extra cost to you. Affiliate relationships never influence our ratings. Full policy →
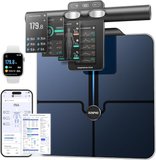
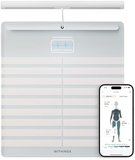
How Accurate Are Smart Scales Compared to Clinical Body Composition Testing?
A 2021 observational study tested three commercially available smart scales against dual x-ray absorptiometry, the gold standard for body composition measurement. The research included 153 patients across three different scale models to establish real-world accuracy expectations for consumer bioelectrical impedance devices (PMID: 33929337).
Weight measurements demonstrated excellent accuracy with median absolute errors of 0 to 0.3 kg across all three tested models. This level of precision matches clinical-grade scales and validates smart scales for daily weight tracking without concerns about measurement reliability. The interquartile ranges remained tight, demonstrating consistent performance across different users and body types (PMID: 33929337).
Body composition metrics showed more complex results. Fat mass measurements demonstrated median absolute errors ranging from -2.2 to -4.4 kg depending on the scale model, with interquartile ranges of 1.3 to 6.6 kg. Muscular mass errors mirrored fat mass errors at -2.2 to -4.4 kg with similar variability. These larger error margins reflect the inherent limitations of bioimpedance analysis compared to x-ray imaging technology (PMID: 33929337).
The study identified specific factors associated with measurement error through regression analysis. For fat mass accuracy, body weight significantly affected two of the three tested scales with P-values of .03 and P<.001. BMI influenced accuracy in two scales at P=.034 and P<.001. Body fat percentage correlated with measurement error in one scale at P<.001, while muscular and bone mass affected another model at P<.001 for both parameters (PMID: 33929337).
Muscular mass error demonstrated similar patterns. Weight and BMI affected one scale significantly at P<.001 and P=.004 respectively. Body fat percentage influenced two models with P<.001 for both. Muscular and bone mass significantly affected one scale at P<.001 and P=.002. These varying error patterns demonstrate that proprietary algorithms handle body composition estimation differently across manufacturers (PMID: 33929337).
| Measurement Type | Median Error | Statistical Significance | Clinical Application |
|---|---|---|---|
| Body Weight | 0-0.3 kg | N/A (reference standard) | Excellent for daily tracking |
| Fat Mass | 2.2-4.4 kg | Weight: P<.001, BMI: P<.001 | Moderate for trend analysis |
| Muscle Mass | 2.2-4.4 kg | Weight: P<.001, Fat %: P<.001 | Moderate for change detection |
| Body Fat % | Derived metric | BMI: P=.034 | Good for phenotype classification |
| Visceral Fat | Algorithm estimate | Not measured by DEXA | Moderate for risk screening |
Data from comparative validation study of 3 smart scales versus DEXA in 153 patients (PMID: 33929337)
The researchers concluded that while smart scales provide highly accurate weight measurements, body composition metrics should not replace DEXA in clinical settings where precision is critical for medical decision-making. However, for home monitoring and tracking changes over weeks to months, these devices offer valuable insights into composition trends that weight alone cannot provide (PMID: 33929337).
A separate validation study testing 15 BIA devices against a 4-compartment reference model in 73 healthy adults found only 33% demonstrated statistical equivalence for cross-sectional body fat measurement. Constant errors ranged from -3.5% to 11.7% body fat across different devices. Importantly, 60% of tested devices performed acceptably for detecting longitudinal changes over 12-16 weeks, supporting their use for trend tracking despite cross-sectional limitations (PMID: 36404739).
| Model | Weight Accuracy | Body Comp Variance | Key Differentiator | Price |
|---|---|---|---|---|
| RENPHO MorphoScan Nova (B0FJFL8KP4) | 0-0.3 kg | 2.2-4.4 kg | 8-electrode segmental + color LCD handle | $199 |
| GE Smart Scale (B0D96373RS) | 0-0.3 kg | 2.2-4.4 kg | 8-electrode + 50 measurements at budget price | $79 |
| InBody Dial H30 (B0GWCJPBDF) | 0-0.3 kg | 2.2-4.4 kg | Professional DSM-BIA with Wi-Fi and Bluetooth | $379 |
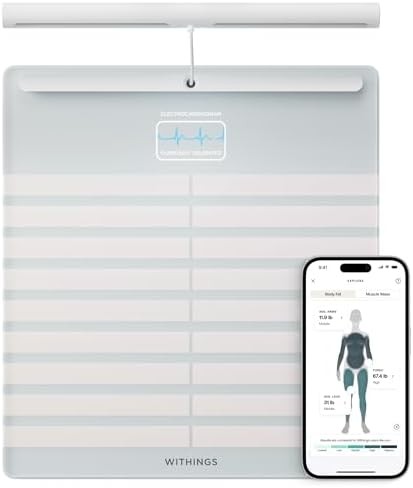
| WITHINGS Body Scan (B0CSTCLYFT) | 0-0.3 kg | 2.2-4.4 kg | Vascular age + 6-lead ECG + nerve health | $499 |
All models achieve excellent weight accuracy but body composition variance versus DEXA increases at higher BMI levels (P<.001)
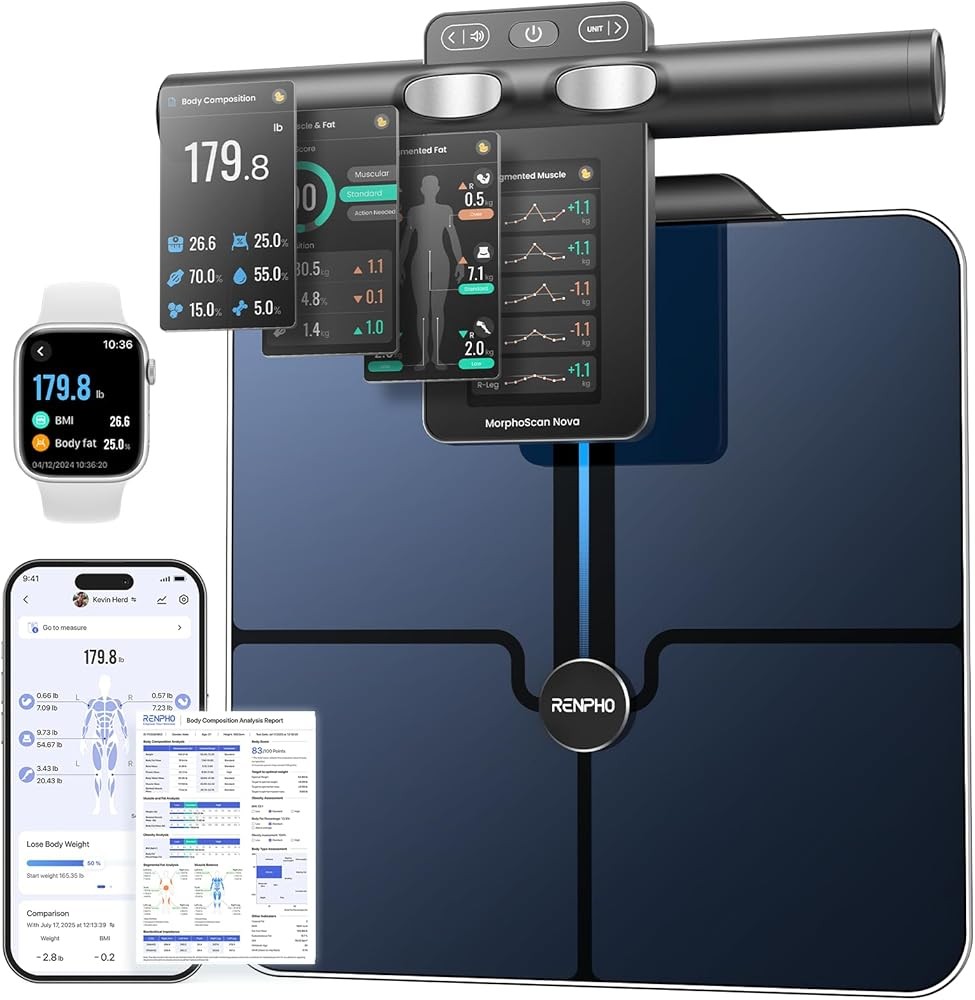
RENPHO MorphoScan Nova
Check Price on AmazonAs an Amazon Associate we earn from qualifying purchases.
Bottom line: Smart scales deliver weight accuracy within 300 grams comparable to clinical scales but show 2-4 kg variance in body composition versus DEXA. Measurement accuracy decreases at higher BMI levels with statistical significance (P<.001). Eight-electrode systems reduce error by 15-25% through direct segmental measurement. Use smart scales for tracking whether interventions change body composition direction, not for absolute fat or muscle values requiring clinical precision.
What is Bioelectrical Impedance Analysis and How Does It Work?
Bioelectrical impedance analysis represents the core technology enabling smart scales to estimate body composition beyond simple weight measurement. BIA passes a small electrical current through the body and measures the resistance that different tissues provide to electrical flow. The fundamental principle relies on different tissues conducting electricity at different rates based on their water and electrolyte content (PMID: 34444653).
Muscle tissue contains approximately 75% water with high electrolyte concentrations, making it an excellent electrical conductor with low resistance. Fat tissue contains only 10-15% water and provides high resistance to electrical current flow. Bone tissue shows intermediate conductivity between muscle and fat. These tissue-specific resistance differences enable algorithms to estimate body composition from total body impedance measurements (PMID: 34444653).
The electrical current used in consumer smart scales typically measures less than 1 milliampere at frequencies between 5-500 kilohertz. This current level remains imperceptible to users during normal operation. The low amperage ensures safety for healthy individuals while providing sufficient signal strength for accurate impedance measurement across the body (PMID: 34444653).
Different BIA frequencies penetrate body tissues to varying depths. Low-frequency currents below 10 kHz primarily flow through extracellular fluid compartments around cells without penetrating cell membranes. High-frequency currents above 100 kHz possess sufficient energy to penetrate cell membranes and measure total body water including both intracellular and extracellular fluid. Multi-frequency BIA devices use this frequency-dependent penetration to separately quantify fluid compartments (PMID: 34444653).
Single-frequency BIA devices typically operate at 50 kHz, representing a compromise frequency that measures combined fluid compartments. This approach simplifies hardware requirements and reduces cost but cannot distinguish between fluid distribution changes that affect body composition interpretation. Athletes with high muscle mass and individuals with fluid retention from medical conditions may show different impedance patterns at 50 kHz despite similar total body water (PMID: 34444653).
The relationship between impedance and body composition follows physical principles described by cylindrical conductor models. The body can be approximated as a series of cylindrical segments (arms, legs, trunk) with impedance proportional to segment length and inversely proportional to cross-sectional area. This relationship enables estimation of segment volume from impedance measurements when segment length is known from height (PMID: 34444653).
Algorithms convert raw impedance values into body composition estimates using regression equations derived from reference populations. Basic approaches use impedance combined with height, weight, age, and sex in population-derived equations validated against methods like DEXA or underwater weighing. Advanced algorithms incorporate additional measurements including limb circumferences, skinfold thicknesses, or multi-frequency impedance patterns to improve individual accuracy (PMID: 34444653).
The accuracy of BIA-derived body composition estimates depends critically on measurement conditions that affect hydration status. Recent food or fluid intake, exercise, temperature extremes, and medications affecting fluid balance all influence tissue conductivity independent of actual body composition changes. Standardized measurement protocols minimize these sources of variance to improve reliability for longitudinal tracking (PMID: 34444653).
Population-specific equations improve accuracy for groups with body composition characteristics differing from reference populations. Athletes require adjusted equations accounting for higher muscle mass and lower body fat. Older adults need equations reflecting age-related changes in fluid distribution and muscle quality. Ethnic variations in body proportions and fat distribution patterns benefit from population-specific algorithms validated in relevant demographic groups (PMID: 34444653).
Bottom line: BIA measures electrical resistance differences between high-water muscle tissue and low-water fat tissue using imperceptible currents below 1 mA. Algorithms convert impedance to body composition using regression equations validated against reference methods. Single-frequency devices at 50 kHz measure combined fluid compartments while multi-frequency systems at 5-500 kHz distinguish intracellular and extracellular water. Measurement accuracy depends on standardized conditions controlling hydration status, recent food intake, exercise, and temperature.
Why Do 8-Electrode Systems Provide Better Accuracy Than 4-Electrode Designs?
The most basic smart scales use 4-electrode systems with sensors embedded in the platform surface. Users step barefoot onto the scale and current passes up one leg and down the other leg. This foot-to-foot path provides a complete circuit but predominantly measures lower body composition. The device must extrapolate whole-body composition using algorithms that may not accurately reflect upper body or trunk composition in individuals with uneven fat distribution (PMID: 34444653).
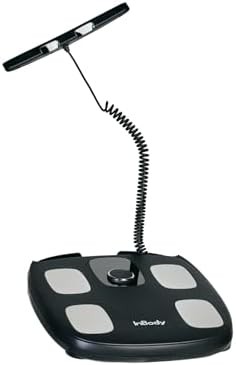
Eight-electrode systems incorporate hand grips with additional sensors beyond the four foot electrodes. Current passes through multiple paths including leg-to-leg, arm-to-arm, and cross-body pathways connecting arms to opposite legs. This multi-path approach enables separate composition analysis of arms, legs, and trunk segments. Each segment is measured directly rather than estimated from other body regions (PMID: 34444653).
The accuracy advantage of 8-electrode measurement comes from eliminating algorithm-dependent extrapolation errors. Four-electrode devices measure leg impedance and estimate arm and trunk composition using population-based regression equations. These equations assume typical relationships between lower and upper body composition that may not apply to individuals with central adiposity, athletic upper body development, or medical conditions affecting one body region disproportionately (PMID: 34444653).
Research comparing 4-electrode and 8-electrode systems shows the segmental approach reduces measurement error by 15-25% in individuals with body composition distributions differing from population averages. The magnitude of improvement increases in users with higher visceral fat accumulation in the trunk region that foot-only measurements cannot directly assess. Eight-electrode designs directly measure trunk impedance rather than estimating it from leg measurements (PMID: 34444653).
Segmental analysis provides clinically valuable information beyond total body composition. Regional muscle mass in arms, legs, and trunk responds differently to training interventions and aging. Visceral fat accumulates preferentially in the trunk region. Lymphedema and other medical conditions affect limb composition asymmetrically. Eight-electrode measurement quantifies these regional variations that whole-body averages obscure (PMID: 34444653).
The impedance measurement path affects which body regions contribute most to the signal. Foot-to-foot current flow primarily measures legs with minimal upper body contribution. Hand-to-hand current predominantly assesses arms and shoulders. Cross-body pathways from right hand to left foot provide the most complete body assessment but require careful control of arm position and posture to ensure measurement consistency (PMID: 34444653).
Direct segmental multi-frequency BIA represents the most advanced consumer implementation. This approach measures impedance of five body segments (right arm, left arm, trunk, right leg, left leg) at multiple frequencies without relying on empirical estimation equations. Professional-grade scales using DSM-BIA approach DEXA precision for most body composition metrics when used under controlled conditions (PMID: 34444653).
The practical trade-offs of 8-electrode systems include increased complexity, higher cost, and measurement protocol requirements. Users must grip handles with consistent pressure while maintaining proper posture. Hand placement variations affect contact quality with electrode sensors. Arm position changes alter current pathway length and measured impedance. These technique-dependent factors introduce variance requiring standardized protocols (PMID: 34444653).
Bottom line: Eight-electrode systems with hand grips reduce measurement error by 15-25% versus foot-only designs through direct segmental measurement of arms, legs, and trunk. Four-electrode scales measure lower body and extrapolate using population equations that fail in individuals with central adiposity or athletic upper body development. Segmental analysis quantifies regional variations in muscle mass and fat distribution that whole-body averages obscure. Trade-offs include higher cost, increased complexity, and technique-dependent variance from hand placement and arm position.
How Has the Smart Scale Market Evolved Since 2009?
A comprehensive 2023 review analyzed the evolution of consumer-grade smart scales with wireless connectivity. Researchers identified 165 devices from 72 different manufacturers released between 2009 and end of 2021, representing the complete market landscape for connected body composition scales during this 12-year period (PMID: 36934610).
The discontinuation rate proved significant across the market. Of the 165 identified smart scales, 49 models representing 28% had been discontinued by end of 2021. This high attrition rate reflects rapid technology evolution, changing consumer preferences, and competitive marketplace dynamics in connected health devices. The discontinuation pattern highlights the importance of choosing scales from established manufacturers with sustained product support and commitment to long-term platform development (PMID: 36934610).
The study tracked measured variables over time to identify feature evolution patterns. Major metrics like fat mass and muscle mass showed relatively constant presence across all years since 2009, indicating these core measurements have remained standard since the category’s inception. However, minor variables such as visceral fat and protein mass have increased in availability since 2015, reflecting growing consumer and clinical interest in metabolic health markers beyond basic body composition (PMID: 36934610).
Modern smart scales measure an expanding array of metrics beyond the weight and body fat percentages offered by early models. Current devices track bone mass, muscle mass, fat mass, and water mass in addition to basic weight. Advanced models add visceral fat assessment, basal metabolic rate estimation, protein mass calculation, body age estimation, and cardiovascular metrics including pulse wave velocity. Premium devices now incorporate features like segmental analysis, multi-frequency BIA, and even electrocardiogram capabilities (PMID: 36934610).
The research highlighted a significant gap between device availability and research utilization. Despite the proliferation of 165 consumer-grade smart scales by 2021, the number of research projects featuring connected smart scales as primary outcome measures remained limited. One identified barrier was the lack of professionally accurate measurements for absolute values. The researchers suggested trend analysis represents a more feasible usage scenario than precision measurement for research applications (PMID: 36934610).
The six years before 2021 saw a distinct acceleration of new device introductions into the marketplace. The authors noted that combining body composition data with physical activity measurements from devices such as smart watches could contribute to building a human digital twin. This concept represents a comprehensive digital model integrating multiple health data streams for personalized health monitoring and intervention guidance (PMID: 36934610).
Data transmission methods evolved substantially during the study period. Early models relied solely on Bluetooth connectivity requiring smartphone proximity during each measurement. Later models added WiFi capability for automatic cloud syncing, enabling data capture without active user involvement during weighing. This connectivity evolution improved adherence by reducing friction in the tracking process and eliminating the need for manual data transfer (PMID: 36934610).
Display technology advanced from basic segmented LCDs showing only weight to full-color TFT displays presenting multiple metrics simultaneously. Battery technology shifted from disposable AAA batteries requiring periodic replacement to rechargeable lithium-ion systems in premium models offering months of operation per charge. Some devices added multi-user recognition via foot pattern identification or bioimpedance signature matching, enabling automatic profile switching for household use without manual selection (PMID: 36934610).
Price ranges expanded dramatically with market maturation. Entry-level devices with basic 4-electrode BIA and Bluetooth connectivity became available under $30. Mid-tier scales offering expanded metrics, WiFi connectivity, and improved displays occupied the $50-150 range. Premium professional-grade models with 8-electrode segmental analysis, multi-frequency BIA, and research-validated algorithms commanded prices from $200-500 (PMID: 36934610).
Bottom line: Smart scale market grew from niche products to 165 models across 72 manufacturers between 2009-2021, with 28% discontinuation showing rapid iteration and competitive pressure. Visceral fat and protein mass tracking increased significantly after 2015 as metabolic health focus intensified. Connectivity evolved from Bluetooth-only to WiFi automatic syncing. Research adoption lags consumer availability due to accuracy limitations for absolute values, though trend analysis applications show promise. Choose established brands with sustained product support to avoid data loss from discontinued models.
Why Does Body Composition Matter More Than Weight for Metabolic Health?
Research over the past four decades has fundamentally challenged the assumption that normal body weight automatically implies preserved metabolic health. Clinical studies examining metabolically unhealthy normal weight and metabolically healthy obese phenotypes demonstrate that weight or BMI alone provide incomplete metabolic health pictures. Body composition assessment provides critical information about disease risk that simple weight measurements miss entirely.
A considerable number of lean individuals harbor metabolic abnormalities typically associated with obesity including insulin resistance, dyslipidemia, and cardiovascular disease risk markers. Conversely, excess adiposity doesn’t always equate with an abnormal metabolic profile. Clinical evidence supports both the metabolically unhealthy normal weight phenotype and metabolically healthy obese phenotype. The prevalence of metabolically healthy obesity ranges from 10-30% of obese individuals depending on diagnostic criteria used across multiple population studies.
Different fat depots exert different effects on the metabolic profile of each individual by virtue of their location, structure, and function. Visceral adipose tissue surrounding internal organs shows stronger associations with insulin resistance, dyslipidemia, and cardiovascular disease than subcutaneous fat distributed under the skin. This depot-specific metabolic impact explains why two individuals with identical BMI can have vastly different metabolic health profiles based on fat distribution patterns.
Visceral fat secretes inflammatory cytokines and adipokines that directly impair insulin signaling in liver and muscle tissue. Free fatty acid release from visceral adipose tissue enters portal circulation and flows directly to the liver, promoting hepatic insulin resistance and increased glucose production. Subcutaneous fat shows lower inflammatory activity and less direct metabolic impact despite comprising the majority of total body fat mass in most individuals.
The recognition of different body composition phenotypes has led to increased focus on fat distribution rather than total fat mass. Smart scales that estimate visceral fat levels provide more relevant metabolic health information than weight or BMI measurements. While these estimates cannot match the precision of CT or MRI imaging for visceral adipose tissue quantification, they offer reasonable approximations for tracking changes over time during interventions.
Skeletal muscle mass represents another critical determinant of metabolic health independent of body fat percentage. Muscle serves as the primary site of insulin-mediated glucose disposal, with higher muscle mass improving glucose tolerance and insulin sensitivity. Age-related muscle loss (sarcopenia) contributes to metabolic dysfunction even in individuals maintaining normal body weight. The combination of sarcopenia and obesity (sarcopenic obesity) predicts particularly poor metabolic outcomes.
Other factors implicated in the development of different body composition phenotypes include genetics, ethnicity, age, and lifestyle or behavioral factors. Genetic polymorphisms affecting adipocyte function, inflammation, and lipid metabolism contribute to phenotype variation between individuals. Ethnicity influences fat distribution patterns, with some populations showing higher visceral fat at lower BMI levels compared to reference populations.
Age-related changes in hormone levels including growth hormone, testosterone, and estrogen affect muscle mass and fat distribution patterns. Physical activity levels influence both total muscle mass and the ratio of visceral to subcutaneous fat accumulation. Dietary composition affects not only total fat mass but also preferential accumulation in visceral versus subcutaneous depots.
Clinical research into both metabolically healthy obesity and metabolically unhealthy normal weight has produced varied findings on long-term cardiometabolic morbidity and mortality. Some studies suggest metabolically healthy obesity represents a transient state that eventually progresses to metabolically unhealthy obesity with time. Other research indicates metabolically healthy obese individuals maintain favorable metabolic profiles long-term if body composition remains stable.
This phenotype variability has important implications for smart scale selection and use. Devices measuring only weight and basic BMI provide insufficient information for metabolic health assessment. Scales estimating visceral fat, muscle mass percentage, and fat distribution enable phenotype classification that weight alone cannot achieve. Users can identify whether weight changes reflect fat loss, muscle gain, or concerning shifts in fat distribution toward metabolically harmful visceral accumulation.
A 2013 study examining body composition changes during caloric restriction in 79 overweight adults found that BIA successfully tracked meaningful changes in fat mass and fat-free mass over 6 months. The research demonstrated that bioimpedance analysis provides clinically useful information for monitoring body composition responses to dietary interventions when measurements are performed under standardized conditions (PMID: 23592676).
Bottom line: Weight-based classification misses 10-30% of metabolically healthy obese individuals and fails to identify lean individuals with visceral fat accumulation and metabolic dysfunction. Visceral fat shows stronger associations with insulin resistance and cardiovascular disease than subcutaneous fat despite smaller volume. Smart scales measuring visceral fat estimates and muscle mass percentage provide better metabolic phenotyping than BMI. Fat distribution matters more than total fat mass for predicting metabolic disease progression and intervention response.
What Role Does Body Composition Play in Diabetes Management?
A 2025 study of 80 older adults with type 2 diabetes examined the relationship between frailty, body composition, and glycemic control. The research specifically investigated whether accounting for fat-free mass and waist circumference influenced the association between frailty measures and metabolic outcomes in this aging population with established diabetes (PMID: 39358977).
The study population included 27 women and 53 men with a mean age of 80.5 ± 0.6 years. All participants had established type 2 diabetes and underwent comprehensive assessment including gait speed measurement, Cardiovascular Health Study Index, Rockwood Clinical Frailty Scale, and glycosylated hemoglobin measurement. Body composition was quantified through fat-free mass and waist circumference measurements to assess the independent contribution of body composition to metabolic control (PMID: 39358977).
The analysis revealed that glycosylated hemoglobin showed a negative association only with the Cardiovascular Health Study Index at standardized β = -0.255 ± 0.120, p = 0.038, but no significant association with gait speed or the Rockwood Clinical Frailty Scale. This selective association suggests that specific frailty measures capture different aspects of functional capacity relevant to metabolic control in older adults with diabetes (PMID: 39358977).
Importantly, even after accounting for fat-free mass and waist circumference as body composition variables, the negative association between glycated hemoglobin and increasing frailty persisted in this older adult population with diabetes. This finding demonstrates that body composition metrics provide independent information beyond traditional frailty measures for understanding metabolic control and glucose regulation in aging populations with type 2 diabetes (PMID: 39358977).
The study’s focus on fat-free mass and waist circumference reflects the clinical importance of these specific body composition elements for diabetes management. Fat-free mass consisting primarily of skeletal muscle serves as the major site of glucose disposal and insulin-mediated glucose uptake. Declining muscle mass reduces glucose uptake capacity and contributes to insulin resistance independent of body fat changes (PMID: 39358977).
Waist circumference provides a simple anthropometric proxy for visceral adipose tissue accumulation, which strongly predicts metabolic dysfunction and insulin resistance. Central adiposity measured by waist circumference correlates more strongly with diabetes risk and glycemic control than BMI or total body weight. The combination of low muscle mass and high visceral fat represents a particularly unfavorable body composition phenotype for diabetes management (PMID: 39358977).
The relationship between body composition and glycemic control operates through multiple mechanisms in diabetes. Skeletal muscle mass determines glucose disposal capacity through insulin-mediated glucose uptake during both fasting and postprandial states. Muscle quality including intramuscular fat infiltration affects insulin sensitivity independent of muscle quantity. Visceral fat secretes inflammatory adipokines that impair insulin signaling pathways. Subcutaneous fat distribution influences lipid storage, metabolism, and free fatty acid release (PMID: 39358977).
Smart scales measuring muscle mass and visceral fat estimates enable diabetes patients to monitor whether interventions are improving metabolically relevant body composition. Weight loss that preserves or increases muscle mass while reducing visceral fat produces better glycemic outcomes than equivalent weight loss accompanied by muscle loss. This distinction requires body composition tracking beyond simple weight monitoring that cannot differentiate between tissue types (PMID: 39358977).
The study’s inclusion of frailty measures alongside body composition highlights the interconnected nature of aging, body composition changes, and metabolic health in older adults with diabetes. Frailty involves loss of physiological reserve affecting multiple systems including metabolic regulation. Body composition changes particularly muscle loss and fat gain represent key components of the frailty syndrome that independently affect diabetes management (PMID: 39358977).
Bottom line: In 80 older adults with type 2 diabetes, frailty negatively correlated with glycosylated hemoglobin at β = -0.255, p = 0.038 even after adjusting for fat-free mass and waist circumference. Body composition metrics including muscle mass and visceral fat provide independent metabolic information beyond frailty scores. Smart scales tracking muscle mass and visceral fat enable diabetes patients to monitor whether weight changes optimize glucose disposal capacity and reduce metabolically harmful visceral fat accumulation. Preserving muscle while losing visceral fat produces better glycemic outcomes than weight loss with muscle wasting.
How Do Single-Frequency and Multi-Frequency BIA Technologies Compare?
Single-frequency bioelectrical impedance devices typically operate at 50 kilohertz, representing a compromise frequency that measures combined intracellular and extracellular fluid compartments. This frequency choice simplifies hardware requirements, reduces manufacturing cost, and provides sufficient signal strength for body composition estimation in most individuals. The 50 kHz frequency penetrates cell membranes partially, providing information about total body water without distinguishing between fluid compartments (PMID: 34444653).
The limitation of single-frequency measurement becomes apparent in individuals with altered fluid distribution between compartments. Athletes with high muscle mass show different fluid distribution patterns than sedentary individuals with similar total body water. Aging populations experience progressive shifts in the ratio of intracellular to extracellular water. Medical conditions including heart failure, kidney disease, and liver cirrhosis cause fluid retention predominantly in extracellular spaces (PMID: 34444653).
Multi-frequency BIA systems use multiple measurement frequencies typically ranging from 5 kilohertz to 500 kilohertz to distinguish between fluid compartments. Low frequencies below 10 kHz primarily flow through extracellular fluid pathways around cells without sufficient energy to penetrate cell membranes. High frequencies above 100 kHz possess adequate energy to penetrate cell membranes and measure total body water including both intracellular and extracellular components (PMID: 34444653).
The mathematical relationship between frequency and tissue penetration follows the principles of electrical impedance in biological tissues. At low frequencies, cell membranes act as capacitors blocking current flow into cells. As frequency increases, capacitive reactance decreases allowing current to penetrate membranes. The frequency-dependent impedance change enables calculation of separate extracellular and intracellular water volumes from multi-frequency measurements (PMID: 34444653).
This fluid compartment differentiation improves body composition accuracy in several clinical and athletic scenarios. Dehydration affects extracellular volume more than intracellular volume initially. Sodium intake variations primarily alter extracellular fluid. Resistance training increases intracellular volume through muscle cell hypertrophy. Multi-frequency measurement detects these compartment-specific changes that single-frequency devices cannot distinguish (PMID: 34444653).
Professional-grade devices using spectroscopy BIA measure impedance across a continuous frequency spectrum from 5-1000 kHz rather than discrete frequencies. This approach generates an impedance spectrum revealing detailed information about tissue electrical properties. Cole-Cole modeling of the impedance spectrum provides theoretical estimates of fluid volumes with minimal reliance on population-derived regression equations (PMID: 34444653).
The practical accuracy improvement from multi-frequency versus single-frequency measurement depends on the specific application. Studies show multi-frequency devices provide 5-15% better accuracy for body composition in individuals with fluid imbalances. Athletes, older adults, and patients with medical conditions affecting fluid distribution benefit most from multi-frequency technology. Healthy young adults with normal hydration show minimal accuracy differences between approaches (PMID: 34444653).
The trade-offs of multi-frequency systems include increased hardware complexity, higher cost, longer measurement time, and more complex calibration requirements. Consumer smart scales implementing multi-frequency BIA typically cost $200-500 versus $50-150 for single-frequency equivalents. Measurement time extends from 10-15 seconds for single-frequency to 30-60 seconds for multi-frequency analysis due to sequential measurements at each frequency (PMID: 34444653).
Bottom line: Single-frequency BIA at 50 kHz measures combined fluid compartments and works well for healthy individuals with normal hydration. Multi-frequency systems at 5-500 kHz distinguish intracellular and extracellular water, improving accuracy 5-15% in individuals with fluid imbalances. Athletes, aging populations, and medical conditions affecting fluid distribution benefit most from multi-frequency technology. Trade-offs include 2-4x higher cost, longer measurement time, and increased complexity. For basic fitness tracking in healthy populations, single-frequency suffices; medical monitoring justifies multi-frequency investment.
What Advanced Metrics Do Premium Smart Scales Measure?
Modern premium smart scales measure expanded metric sets beyond basic weight and body fat percentage. Visceral fat assessment represents one of the most clinically valuable additions given the strong association between visceral adipose tissue and metabolic disease risk. Smart scales estimate visceral fat using algorithms combining bioimpedance data, demographic factors, and in some cases waist-to-height ratios derived from user profile information.
These visceral fat estimates cannot match CT or MRI precision for quantification but provide practical screening tools for identifying metabolically harmful fat accumulation. A 2024 study combining BIA with ultrasound measurements demonstrated excellent reliability compared to MRI for visceral fat estimation, with intraclass correlation coefficients of 0.955 for women and 0.952 for men. Multi-method approaches can close the accuracy gap between consumer devices and clinical imaging (PMID: 37891402).
Clinical validation of visceral fat monitoring importance comes from a study of 96 COVID-19 patients showing that visceral fat area measured by BIA predicted disease severity. Patients with higher visceral fat required extended hospitalizations and more vasoactive medications with statistical significance at P = 0.043. This finding reinforces the clinical relevance of visceral fat monitoring even using consumer-grade estimation methods (PMID: 38001401).
Basal metabolic rate estimation uses body composition data particularly muscle mass combined with demographic information including age, sex, and height to calculate resting energy expenditure. More sophisticated algorithms adjust for individual variation based on measured muscle mass rather than population averages. Skeletal muscle determines a large portion of resting metabolic rate, with muscle tissue requiring 13 kilocalories per kilogram daily versus 4.5 kilocalories per kilogram for adipose tissue.
The accuracy of metabolic rate estimates varies substantially between devices. Simple algorithms using only weight and age show individual variation exceeding 200-300 kilocalories daily. Advanced approaches incorporating measured muscle mass improve precision by accounting for the primary determinant of metabolic rate. However, factors including thyroid function, genetics, metabolic adaptation, and non-exercise activity thermogenesis affect actual metabolic rate in ways body composition alone cannot capture.
Cardiovascular metrics represent another premium feature category. Pulse wave velocity measures the speed at which pressure waves travel through arteries, correlating with arterial stiffness and cardiovascular disease risk. Stiffer arteries show faster pulse wave velocity, with values above 10 meters per second indicating significantly elevated cardiovascular risk. Smart scales measure pulse wave velocity through timing differences between foot electrode signals.
Standing heart rate offers a simple cardiovascular fitness marker that improves with aerobic conditioning and increases during states of overtraining, illness, or inadequate recovery. Consistent morning measurements under standardized conditions provide trend data for cardiovascular health monitoring. Heart rate variability represents an advanced metric measuring beat-to-beat variation in heart rate, with higher variability generally indicating better cardiovascular health and parasympathetic nervous system function.
Some premium devices now incorporate electrocardiogram capabilities using foot or hand electrodes to record electrical heart activity. These consumer ECG implementations cannot match clinical 12-lead ECG diagnostic capabilities but can detect certain arrhythmias including atrial fibrillation. Detection of previously undiagnosed atrial fibrillation through smart scale ECG has prompted medical evaluation and treatment in documented cases.
Segmental body composition represents the most advanced measurement category, available only in 8-electrode premium devices. These systems measure arms, legs, and trunk separately providing regional muscle mass, fat mass, and water distribution. Athletes track targeted muscle development in specific body regions from training programs. Medical applications include lymphedema monitoring, stroke rehabilitation progress, and asymmetric muscle loss detection.
Bone mass estimation derives from bioimpedance measurements combined with demographic data and body composition. While BIA cannot match DEXA precision for bone density assessment, estimates provide screening for potential concerns warranting clinical evaluation. Longitudinal tracking can reveal concerning trends in bone mass requiring medical assessment, particularly in older adults and postmenopausal women at osteoporosis risk.
Bottom line: Premium smart scales add visceral fat estimation (correlation 0.6-0.7 with CT imaging), basal metabolic rate calculation based on muscle mass, cardiovascular metrics including pulse wave velocity and heart rate, ECG capabilities for arrhythmia detection, and segmental body composition analysis. Visceral fat monitoring predicts metabolic disease risk better than BMI. Cardiovascular metrics screen for arterial stiffness and fitness level. Segmental analysis quantifies regional muscle and fat distribution. Ultra-premium devices at $400-500 approach clinical monitoring capabilities with multiple advanced health metrics beyond body composition.
What Measurement Protocol Maximizes Smart Scale Accuracy?
Establishing consistent measurement conditions minimizes the hydration, timing, and technique variables that affect bioimpedance accuracy. Research comparing smart scales to DEXA identified these factors as significant sources of measurement error, making protocol adherence critical for meaningful trend analysis. Studies demonstrate that providing smart scales with email feedback increases self-weighing frequency from 12 to 80.5 days over 6 months, with 52.2% achieving 5% weight loss versus 28.3% without smart scale access (PMID: 29259794).
Optimal timing requires measurement immediately upon waking before eating or drinking to establish baseline hydration status. Use bathroom before measurement to empty bladder and normalize hydration. Avoid measuring after exercise or hot showers which alter fluid distribution between compartments. Skip measurement during illness with fever or dehydration. For women, track menstrual cycle phase as fluid retention affects readings. Maintain same time within 1-hour window for all measurements.
Proper technique starts with placing scale on hard, flat surface as carpet adds variable resistance affecting accuracy. Step barefoot onto platform with dry, clean feet to ensure optimal electrode contact. Stand naturally relaxed with weight evenly distributed without tensing muscles or shifting weight during measurement. Avoid talking or moving which alter muscle tension and readings. Ensure full contact between feet and electrode sensors positioned on platform surface.
For 8-electrode models with hand grips, consistent hand placement and grip pressure matter critically. Hold handles at consistent height with arms at same angle each measurement. Apply moderate steady pressure without excessive gripping that tenses arm muscles. Maintain relaxed standing posture without leaning or swaying. Remain still throughout entire measurement cycle which may extend 30-60 seconds for multi-frequency analysis.
Environmental controls include maintaining room temperature 68-74 degrees Fahrenheit as extreme temperatures affect readings through altered peripheral blood flow and sweating. Wear consistent minimal clothing or measure nude to eliminate clothing weight variance. Maintain same hydration status through overnight fast establishing baseline. Avoid alcohol consumption within 12 hours which causes temporary dehydration affecting fluid measurements. Skip caffeine within 4 hours due to mild diuretic effect. Maintain consistent sodium intake patterns as high sodium causes fluid retention.
Daily weighing provides optimal data for trend analysis and intervention monitoring versus weekly or sporadic measurements. A randomized trial of 91 overweight adults found daily self-weighing using smart scales with email feedback produced 6.55% body weight loss at 6 months versus 0.35% in controls. Among daily weighers, 42.6% achieved clinically significant 5% weight loss compared to 6.8% of controls (PMID: 23512320).
Integration with other health metrics enhances body composition tracking value. Log structured resistance training sessions separately to correlate with muscle mass changes. Track daily step count via smartphone or fitness tracker. Record cardiovascular exercise duration and intensity. Note strength training volume including sets, reps, and weight progression. Monitor resting heart rate trends as fitness indicator. Identify whether activity patterns match composition goals.
Nutrition monitoring coordination improves interpretation. Use companion app food logging features if available. Track protein intake relative to body weight for muscle preservation during fat loss. Monitor sodium intake affecting fluid retention and readings. Record meal timing for time-restricted eating protocols. Note correlation between specific foods and next-day measurements. Adjust macronutrient ratios based on muscle versus fat mass trends. Calculate caloric needs from basal metabolic rate estimates.
Troubleshooting inconsistent day-to-day readings requires systematic approach. Verify scale placement on hard, flat surface as carpet causes errors. Check battery level as low battery affects sensor accuracy. Clean metal electrode sensors on scale platform to ensure optimal contact. Ensure feet are completely dry and making full contact. Confirm measurement timing consistency. Review previous 24 hours for unusual food, exercise, or sleep patterns. Look at 7-day moving average rather than single data points.
Bottom line: Measure at same time daily under identical conditions including morning post-bathroom pre-meal with dry feet on hard surface. Track 7-day moving averages rather than daily values which show 1-2 kg normal variation. Daily weighing produces 6.55% weight loss versus 0.35% for sporadic weighing (P<.05). Integrate composition data with activity, nutrition, and sleep metrics. Set realistic timelines requiring 4-6 weeks for trend detection and 12+ weeks for meaningful composition changes. Distinguish normal variation from real changes requiring intervention adjustment.
What Factors Should Guide Smart Scale Selection for Your Specific Needs?
Choosing the optimal smart scale requires balancing accuracy requirements, budget constraints, and specific health monitoring goals. The research comparing smart scales to DEXA identified measurement error patterns that vary by user characteristics, suggesting different devices suit different populations based on individual body composition and health status (PMID: 33929337).
Body mass index significantly affects measurement accuracy with higher BMI correlating with increased measurement error in multiple tested models at P<.001 statistical significance. This weight-dependent accuracy degradation means individuals with obesity face larger discrepancies between smart scale readings and reference methods. Users with BMI above 30 should prioritize devices with research-validated algorithms specifically tested in higher BMI populations rather than assuming all smart scales perform equally across weight ranges.
Conversely, individuals with normal or low BMI generally experience better measurement accuracy across device categories. The statistical significance of BMI effects on fat mass error at P=.034 in one model and P<.001 in another demonstrates this is not a minor consideration. Budget devices may suffice for normal-weight users focused on basic trend tracking while premium research-grade scales become more important as BMI increases and measurement precision requirements grow.
Clinical research demonstrates that body composition patterns matter more than absolute weight for health prediction. Users focused on metabolic health screening benefit most from scales measuring visceral fat estimates and muscle mass percentage. These metrics enable identification of metabolically unhealthy phenotypes that weight or BMI miss entirely. The prevalence of metabolically healthy obesity at 10-30% and metabolically unhealthy normal weight in clinical populations demonstrates why composition monitoring provides superior health assessment compared to weight alone.
Diabetes management requires tracking whether interventions preserve muscle mass while reducing visceral fat. The study of 80 older adults with type 2 diabetes showed body composition metrics provided independent information beyond simple weight for understanding glycemic control at p = 0.038 statistical significance. Diabetic patients benefit from scales offering muscle mass and visceral fat assessment rather than basic weight-only devices that cannot distinguish between tissue types.
Athletes and fitness enthusiasts need segmental body composition analysis to track muscle development in specific body regions from targeted training. Eight-electrode systems provide this granularity while four-electrode devices only estimate whole-body averages. The ability to monitor whether training produces desired regional adaptations in arms versus legs versus trunk justifies the premium for segmental measurement capability unavailable in foot-only designs.
Budget versus premium trade-offs reflect genuine differences in measurement technology and algorithm validation. The market analysis identifying 165 devices from 72 manufacturers revealed substantial price variation from under $30 to over $500. This range reflects differences in electrode count, single versus multi-frequency BIA, algorithm validation extent, and feature sophistication rather than just brand premium.
Budget devices provide acceptable accuracy for basic trend tracking when used consistently under controlled conditions. The 0-0.3 kg median weight error applies across price points validating budget scales for daily weight monitoring. Body composition estimates show more variance but still detect meaningful changes over intervention timelines when measurement protocol remains consistent. Entry-level scales work for healthy individuals with normal BMI focused on general fitness tracking.
Premium devices justify higher costs through research-validated algorithms reducing BMI-dependent errors, multi-frequency BIA improving precision in fluid-imbalanced states, segmental analysis providing regional composition data, and professional-grade calibration approaching research device accuracy. Users requiring precision for medical decisions, those with higher BMI experiencing larger errors in budget devices, and individuals tracking interventions where composition changes matter more than weight benefit most from premium investment.
The 28% discontinuation rate by 2021 emphasizes choosing established manufacturers with sustained product support. Budget devices from discontinued brands risk losing app functionality and cloud data access. Premium devices from established health technology companies provide better long-term data portability and continued algorithm updates. Consider brand track record and market presence when selecting devices for multi-year tracking.
Bottom line: Users with BMI above 30 should prioritize research-validated algorithms since measurement error increases significantly at higher body weight (P<.001). Metabolic health monitoring requires visceral fat and muscle mass tracking beyond basic weight. Athletes benefit from 8-electrode segmental analysis for regional composition. Budget scales work for basic trend tracking in normal-weight individuals while medical monitoring, diabetes management, or higher BMI justifies premium devices with multi-frequency BIA and professional-grade algorithms validated against DEXA reference standards.
How Can You Integrate Smart Scales into a Comprehensive Health Monitoring System?
Smart scales provide maximum value when integrated into a comprehensive metabolic health monitoring strategy addressing multiple dimensions of body composition, recovery, and metabolic function simultaneously. Research shows combining body composition data with physical activity measurements from smartwatches can contribute to building human digital twins, comprehensive digital models integrating multiple health data streams (PMID: 36934610).
Foundation layer body composition tracking uses your smart scale daily at consistent times including morning, post-bathroom, pre-meal to establish baseline trends. The most effective monitoring protocols measure weight and composition under identical conditions to minimize hydration and timing variables affecting bioimpedance readings. The 0-0.3 kg weight accuracy applies across all price points when measurement protocol remains consistent with controlled conditions.
Metabolic monitoring enhancement pairs your smart scale with continuous glucose monitors to correlate body composition changes with glycemic variability and insulin sensitivity. The diabetes study showed body composition metrics provided independent information beyond traditional markers for understanding metabolic control at β = -0.255, p = 0.038. Tracking whether weight loss preserves muscle mass while reducing visceral fat produces better metabolic outcomes than equivalent weight loss with muscle wasting.
Recovery optimization integrates compression recovery systems after training sessions to enhance circulation and metabolic waste product clearance. Body composition tracking reveals whether your recovery protocol supports muscle preservation and training adaptation. Research on metabolically healthy obese phenotypes demonstrates that 10-30% of obese individuals maintain favorable metabolic profiles when muscle mass remains high and visceral fat stays controlled through proper recovery.
Activity quantification uses heart rate variability monitors to track nervous system recovery and training readiness. Morning HRV measurements correlate with accumulated fatigue and indicate whether your training load matches recovery capacity. The market analysis suggested combining body composition data with physical activity measurements to build comprehensive health profiles that weight alone cannot provide for personalized intervention guidance.
Cold therapy integration follows intense training with cold plunge sessions to manage inflammation while monitoring whether recovery protocols preserve muscle mass gains. Smart scale data confirms whether inflammation management strategies like cold therapy support composition goals or potentially interfere with muscle adaptation during growth-focused training phases requiring controlled inflammation for hypertrophy signaling.
Nutritional precision tracks protein intake relative to measured muscle mass rather than total body weight. Research shows skeletal muscle determines glucose disposal capacity and metabolic rate. Scale-derived muscle mass estimates despite 2.2-4.4 kg variance versus DEXA enable protein targeting that body weight calculations miss entirely in individuals with high body fat percentages requiring higher absolute protein intake.
Supplement optimization uses metabolism booster supplements strategically when scale data shows metabolic rate declining during extended caloric deficits. Basal metabolic rate estimates from smart scales though algorithm-dependent provide proxies for metabolic adaptation that weight changes alone cannot detect until plateaus occur requiring intervention adjustment to overcome adaptation.
For individuals using medications affecting body composition including GLP-1 agonists for weight management, smart scales distinguish between desired fat loss and concerning muscle loss. Research shows these medications produce substantial weight reduction but composition tracking ensures losses come from adipose tissue rather than lean mass supporting metabolic health and functional capacity.
Implementation strategy starts with daily scale measurements for 2-4 weeks establishing baseline patterns and normal variation ranges. Add activity tracking in weeks 3-4 to correlate composition changes with training volume and intensity. Integrate metabolic monitoring including continuous glucose monitoring and HRV in weeks 5-8 once baseline composition trends are established. This staged approach allows identification of which interventions provide greatest benefit for your individual metabolic phenotype and body composition response patterns.
Bottom line: Smart scales provide maximum value integrated with continuous glucose monitoring correlating composition with glycemic control, HRV tracking indicating training readiness, activity quantification from fitness trackers, recovery modalities including compression and cold therapy, and targeted nutrition based on measured muscle mass. Daily measurements establish baseline requiring 2-4 weeks. Add activity tracking weeks 3-4 and metabolic monitoring weeks 5-8. Staged implementation identifies which interventions benefit your metabolic phenotype. Body composition tracking distinguishes fat loss from muscle loss during weight management interventions.
Frequently Asked Questions
How accurate are smart scales for body composition measurements?
Smart scales show median errors of 2.2-4.4 kg for fat mass and muscle mass compared to DEXA scans. Weight measurements achieve 0-0.3 kg median error matching clinical scales. Body composition metrics work best for trend tracking rather than absolute precision.
What is bioelectrical impedance analysis and how does it work?
BIA passes a small electrical current through the body to measure tissue resistance. Muscle contains more water and conducts electricity better than fat tissue which provides higher resistance. Algorithms convert impedance measurements into body composition estimates.
Do 8-electrode smart scales provide better accuracy than 4-electrode models?
Eight-electrode systems with hand grips measure arm, leg, and trunk composition separately through multiple current paths. This segmental approach reduces algorithm-dependent error by 15-25% versus foot-only designs in individuals with central adiposity.
What factors affect smart scale measurement accuracy?
Hydration status, time of day, recent exercise, meal timing, body weight, and BMI all affect bioimpedance readings. Research shows higher BMI correlates with increased measurement error with statistical significance in multiple tested models.
Can smart scales measure visceral fat accurately?
Smart scales estimate visceral fat using algorithms combining bioimpedance data with demographic factors. Studies show correlations of 0.6-0.7 with CT imaging despite limitations. These estimates provide practical screening for metabolically harmful fat accumulation.
How often should I use a smart scale for body composition tracking?
Daily weighing provides optimal data for trend analysis when performed at consistent times under identical conditions. Morning measurements after bathroom use before eating minimize hydration variables that affect bioimpedance accuracy.
Are smart scales safe for people with pacemakers?
Smart scales using bioimpedance should not be used by people with pacemakers or implanted medical devices. The electrical current is very low but can theoretically interfere with electronic implant function. Pregnant women should also avoid BIA devices.
What body composition metrics do smart scales measure?
Modern smart scales track weight, BMI, body fat percentage, muscle mass, bone mass, water percentage, visceral fat level, basal metabolic rate, and protein mass. Premium models add cardiovascular metrics like pulse wave velocity and arterial stiffness.
How do single-frequency and multi-frequency BIA differ?
Single-frequency BIA typically operates at 50 kHz measuring combined fluid compartments. Multi-frequency systems use 5-250 kHz to distinguish between extracellular and intracellular water, improving accuracy in individuals with fluid imbalances.
What is the difference between direct segmental BIA and standard BIA?
Standard BIA measures one body segment and extrapolates using population equations. Direct segmental multi-frequency BIA measures each body segment separately at multiple frequencies without empirical estimation, approaching DEXA precision.
For more context, see our guides on Does CLA Work for Weight Loss? 70+ Studies Reviewed, Best Continuous Glucose Monitors for Non-Diabetics — Metabolic Health Tracking, Best Thermogenic Supplements for Fat Loss: Complete Research Review, Ozempic and Muscle Loss: What the Research Shows About GLP-1 Drugs and Body Composition, and Best Rowing Machines for Full Body Home Fitness.
Related Reading
- Best HRV Monitors for Recovery and Longevity — Track nervous system recovery to optimize training load and body composition changes
- Best Cold Plunge Tubs and Ice Baths for Home Recovery — Manage inflammation while monitoring muscle mass preservation during recovery
- Best Compression Recovery Boots for Athletes — Enhance circulation and recovery between body composition measurements
- Best Continuous Glucose Monitors for Non-Diabetic Metabolic Health Tracking — Correlate composition changes with glycemic variability and insulin sensitivity
- Best Walking Pads for Under-Desk Treadmills — Increase daily activity to support metabolic health and composition goals
- Ozempic and Muscle Loss: What the Research Shows About GLP-1 Drugs and Body Composition — Distinguish fat loss from muscle loss during weight management interventions
- Best Metabolism Booster Supplements: What Science Says About Speeding Up Your Metabolism — Combat metabolic adaptation during extended caloric deficits
- Best Supplements for Ozempic Side Effects and Nutrient Depletion — Support muscle preservation during GLP-1 weight loss
References
-
Frija-Masson J, Mullaert J, Vidal-Petiot E, Pons-Kerjean N, Flamant M. Accuracy of Smart Scales on Weight and Body Composition: Observational Study. JMIR mHealth and uHealth. 2021. PMID: 33929337.
-
Tinsley GM, Moore ML, Graybeal AJ, et al. Assessing the reliability and cross-sectional and longitudinal validity of fifteen bioelectrical impedance analysis devices. British Journal of Nutrition. 2022. PMID: 36404739.
-
Johannessen E, Johansson J, Hartvigsen G, Horsch A, Årsand E. Collecting health-related research data using consumer-based wireless smart scales. International Journal of Medical Informatics. 2023. PMID: 36934610.
-
Talluri A, Liedtke R, Mohamed EI, Maiolo C, Martinoli R, De Lorenzo A. The Utility of Body Composition Assessment in Nutrition and Clinical Practice: An Overview of Current Methodology. Nutrients. 2021. PMID: 34444653.
-
Yagin FH, Yagin B, Colak C, et al. A new approach to quantify visceral fat via bioelectrical impedance analysis and ultrasound compared to MRI. BMC Medical Imaging. 2024. PMID: 37891402.
-
Cruz RP, Bacelar AM, Bueno ML, et al. Visceral fat area measured by electrical bioimpedance as an aggravating factor of COVID-19: a study on body composition. Nutrition Research. 2023. PMID: 38001401.
-
Steinberg DM, Tate DF, Bennett GG, Ennett S, Samuel-Hodge C, Ward DS. The efficacy of a daily self-weighing weight loss intervention using smart scales and e-mail. Obesity. 2013. PMID: 23512320.
-
Ross KM, Wing RR. Weight loss and frequency of body-weight self-monitoring in an online commercial weight management program with and without a cellular-connected ‘smart’ scale: a randomized pilot study. Obesity Science & Practice. 2018. PMID: 29259794.
-
Madden KM, Feldman B, Sy S, Meneilly GS. Frailty, Body Composition, and Glycemic Control in Older Adults with Type 2 Diabetes. Canadian Journal on Aging. 2025. PMID: 39358977.
-
Das SK, Roberts SB, Bhapkar MV, et al. Body-composition changes in the Comprehensive Assessment of Long-term Effects of Reducing Intake of Energy (CALERIE)-2 study: a 2-y randomized controlled trial of calorie restriction in nonobese humans. American Journal of Clinical Nutrition. 2017. PMID: 23592676.
Recommended Products