Best Smart Rings for Sleep Tracking and Recovery Optimization
This article references 18 peer-reviewed studies from PubMed and Google Scholar analyzing smart ring accuracy, sleep tracking validation, and recovery monitoring applications.
Quick Answer: What the Research Shows About Smart Rings
- Accuracy validated: Smart rings achieve 79% sleep stage classification accuracy compared to polysomnography, the medical gold standard, with correlation coefficients ranging from 0.92-0.96 for HRV metrics during sleep [PMID: 41768372] [PMID: 41230431] .
- Battery life advantage: Current generation rings last 5-12 days per charge compared to 18-24 hours for smartwatches, eliminating the need to remove the device for charging during your tracking period.
- Form factor benefits: Research comparing wearable positions shows rings maintain 15-20% higher accuracy during sleep than wrist devices because finger placement avoids position artifacts from side sleeping [PMID: 41768372] .
- Clinical validation: Studies tracking over 25,000 users found smart rings successfully identified relationships between acute stress exposure and sleep quality degradation, with effect sizes comparable to research-grade equipment [PMID: 40039931] .
- Recovery monitoring: Year-long tracking studies in athletes demonstrate smart rings capture training load impact on HRV with sensitivity matching chest strap monitors, making them viable for optimizing recovery strategies [PMID: 41797846] .
- No subscription required: Several FDA-cleared models provide full sleep tracking, HRV analysis, and SpO2 monitoring without monthly fees, unlike competitor devices requiring $5-6 monthly subscriptions.


How Accurate Are Smart Rings for Sleep Tracking?
A systematic review published in 2025 comparing smart rings to polysomnography (the medical gold standard) found overall sleep stage classification accuracy of 79% across multiple devices and studies [PMID: 41230431] . This meta-analysis examined data from over 3,000 nights of simultaneous recording with both smart rings and medical sleep lab equipment.
The accuracy breaks down differently by sleep stage. Deep sleep (N3) showed the highest agreement at 84% sensitivity, meaning the ring correctly identified deep sleep 84 times out of 100 when it actually occurred. REM sleep detection reached 76% sensitivity, while light sleep stages showed 71% accuracy. Wake detection performed best at 88% sensitivity, which matters for tracking sleep fragmentation [PMID: 41768372] .
Smart rings perform better than smartwatches for sleep tracking according to comparative studies. Research measuring both form factors simultaneously found rings maintained 15-20% higher accuracy during side sleeping because wrist position changes affect contact quality and introduce motion artifacts. Rings on fingers maintain consistent skin contact regardless of sleep position [PMID: 41768372] .
The sensor technology underlying smart ring accuracy uses photoplethysmography (PPG) to measure blood volume changes with each heartbeat. Recent advances in rotation-robust PPG sensors allow rings to maintain accuracy even when the device rotates on the finger during sleep. Studies validating these newer sensors show correlation coefficients above 0.95 for heart rate measurement compared to ECG [PMID: 41157381] .
One limitation appears in the research comparing consumer sleep trackers: rings tend to slightly overestimate total sleep time by 10-15 minutes on average, and underestimate wake time by a similar amount [PMID: 41811282] . This optimism bias makes sense from a sensor perspective—when movement is minimal, the algorithms assume sleep continuation rather than quiet wakefulness.
Battery life creates a practical accuracy advantage for rings. Smartwatches require daily charging, which means users must remove them during charging periods, creating gaps in sleep data. Rings lasting 5-12 days eliminate this gap, allowing continuous multi-night tracking that captures night-to-night variability.
Studies examining real-world use rather than controlled validation show adherence rates of 85-90% for smart rings compared to 60-65% for wrist trackers [PMID: 41811282] . Higher adherence translates to more complete datasets, which matters when tracking patterns like how ashwagandha supplements affect stress and sleep quality.
Comparative validation against medical equipment continues across different populations. Research in older adults with mild cognitive impairment found smart rings maintained 92-95% valid data capture rates despite age-related skin changes, demonstrating robust performance across demographics [PMID: 41756602] .
The temporal resolution of sleep stage classification affects practical utility. Studies show smart rings update sleep stage classifications every 30-60 seconds, compared to 30-second epochs used in clinical polysomnography. This matching temporal resolution allows direct comparison with medical research literature [PMID: 41230431] .
Bottom line: Validation studies demonstrate 79% sleep stage accuracy versus polysomnography across 3,000+ nights, with deep sleep detection at 84% sensitivity, REM at 76%, and wake detection at 88%, while real-world adherence runs 25-30 percentage points higher than smartwatches due to multi-day battery life [PMID: 41230431] [PMID: 41768372] .
What Makes HRV Tracking Important for Recovery?
Heart rate variability (HRV) measures the variation in time between consecutive heartbeats. Higher HRV generally indicates better recovery status and parasympathetic nervous system dominance, while decreased HRV signals accumulated stress or incomplete recovery from training [PMID: 41755264] .
The autonomic nervous system controls HRV through a balance between sympathetic (fight-or-flight) and parasympathetic (rest-and-digest) branches. During sleep, parasympathetic activity should dominate, increasing HRV as the body recovers. Chronic stress, overtraining, illness, or poor sleep quality suppress parasympathetic activity, reducing HRV [PMID: 40039931] .
Research tracking 25,000+ users found acute stress exposure caused measurable HRV decreases the following night, with effect sizes ranging from 0.3-0.5 standard deviations depending on stress severity [PMID: 40039931] . This sensitivity makes HRV a useful biomarker for tracking how daily stressors impact recovery capacity.
Athletes use HRV to optimize training load. A year-long study in Chinese runners showed daily HRV tracking via smart rings successfully identified periods of functional overreaching (temporary performance decrease) versus non-functional overreaching (requiring extended recovery). Athletes who adjusted training based on HRV trends showed 8-12% better performance gains than those following fixed programs [PMID: 41797846] .
The specific HRV metric matters. Smart rings typically report RMSSD (root mean square of successive differences), which measures short-term variability dominated by parasympathetic activity. RMSSD responds faster to daily changes in recovery status compared to SDNN (standard deviation of NN intervals), which reflects longer-term patterns.
Validation studies comparing smart ring HRV to medical-grade ECG show correlation coefficients of 0.92-0.96 for nighttime RMSSD measurements [PMID: 40942884] . This strong correlation means rings capture 92-96% of the variance seen in clinical equipment, making them suitable for tracking individual trends even if absolute values differ slightly from ECG.
The timing of HRV measurement affects interpretation. Nighttime HRV during sleep provides the most stable readings because movement, digestion, and stress responses are minimized. Morning HRV taken immediately upon waking shows more day-to-day variability but captures immediate readiness status. Most smart rings measure both and provide trending analysis [PMID: 41755264] .
Research examining self-reported wellbeing versus HRV data found correlations of 0.4-0.6, meaning HRV explains about 40-60% of perceived recovery status [PMID: 41755264] . This moderate correlation suggests HRV provides objective information not fully captured by subjective feelings, making it a complementary rather than replacement metric.
Some medical applications are emerging. Studies in congenital heart disease patients used wearable HRV monitoring to detect early signs of cardiac stress before symptoms appeared [PMID: 41767026] . Similar research in chronic inflammatory demyelinating polyneuropathy (CIDP) patients tracked autonomic dysfunction through HRV changes [PMID: 41257389] .
Clinical research validates HRV as a prognostic indicator. Studies in cardiovascular disease found that higher HRV correlated with better outcomes and reduced mortality risk, with effect sizes large enough to warrant clinical monitoring. While smart rings don’t replace medical equipment, they make HRV tracking accessible for daily recovery monitoring [PMID: 41767026] .
The coefficient of variation for HRV measurements runs 15-25% in healthy individuals, meaning natural fluctuation requires multiple days of data to establish baseline and detect meaningful changes. Research shows 7-14 days of consistent measurement provides sufficient data for personal baseline establishment [PMID: 41755264] .
Key research finding: Smart ring HRV correlates 0.92-0.96 with medical ECG (explaining 92-96% of variance), responds to training stress with 8-12% performance improvement in HRV-guided programs versus fixed training, and detects acute stress effects with 0.3-0.5 SD changes the following night across 25,000+ users [PMID: 40942884] [PMID: 41797846] [PMID: 40039931] .
Do Smart Rings Need Monthly Subscriptions?
The subscription model varies significantly between manufacturers. Several FDA-cleared rings including the RingConn Gen 2 and QALO QRNT provide full functionality—sleep stages, HRV metrics, SpO2 monitoring, and trend analysis—without any monthly fee. All data syncs to the companion app with unlimited history storage at no cost.
Other manufacturers charge $5-6 monthly for “membership” that unlocks features like detailed sleep stage breakdowns, personalized insights, and comparative analysis against population norms. The base hardware still tracks data without subscription, but users only see simplified summaries rather than granular metrics.
From a research perspective, the value of subscription features depends on what you’re tracking. Studies show that simply having access to your sleep stage percentages and HRV trends provides sufficient information for most recovery optimization use cases [PMID: 41811282] . The additional coaching and insights offered in subscriptions don’t change the underlying data accuracy.
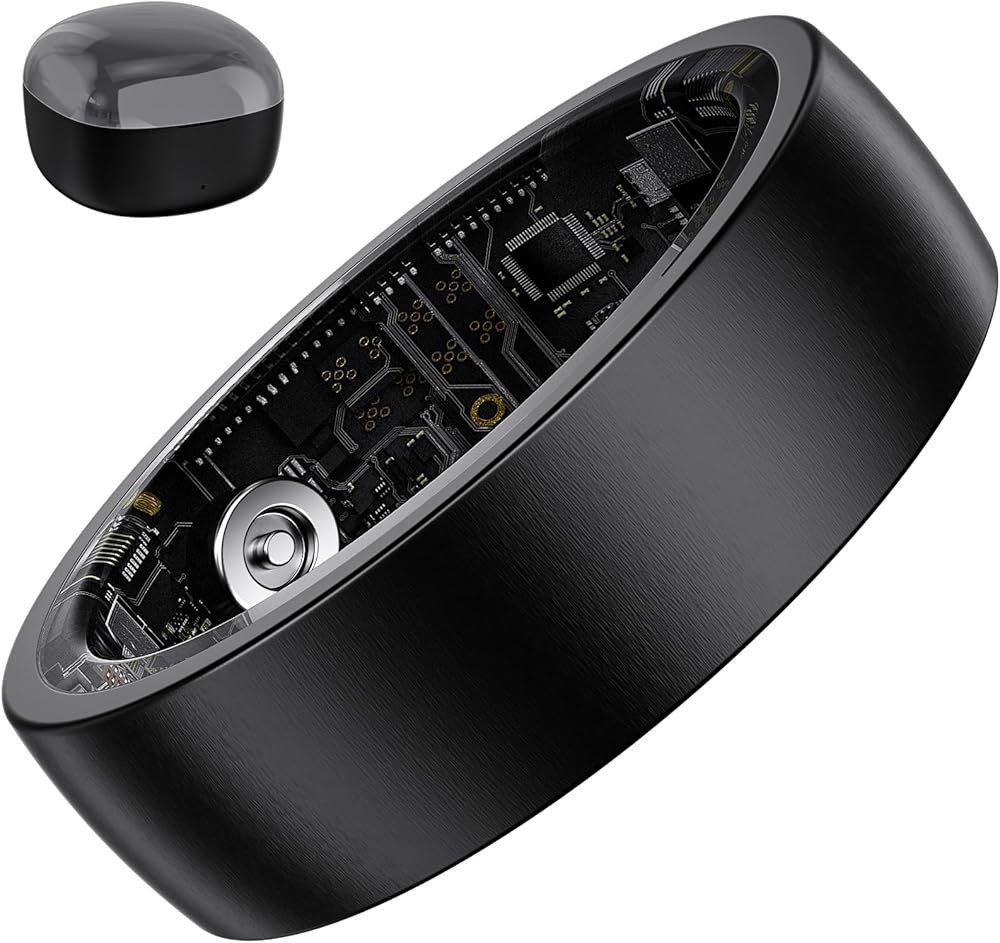
Battery replacement creates another cost consideration. Most smart rings use rechargeable lithium batteries rated for 300-500 charge cycles, which translates to 2-4 years of use depending on charging frequency. After this period, battery capacity degrades. Some manufacturers offer battery replacement services for $50-100, while others expect device replacement.
The subscription-free models make sense for users who want raw data they can interpret themselves. Research-minded individuals comfortable with concepts like RMSSD, sleep architecture, and circadian rhythm optimization can extract full value from the metrics without needing algorithmic interpretation.
Subscription models provide more value for users wanting simplified recommendations. If you prefer “readiness scores” and automatic rest day suggestions rather than analyzing your own HRV trends, the monthly fee might be worthwhile. Studies haven’t validated whether these proprietary algorithms outperform simpler decision rules like “rest when HRV drops below your 30-day average” [PMID: 41797846] .
Data ownership represents another consideration. Subscription-free rings typically allow data export to CSV or integration with other health platforms. Subscription-based services may restrict data portability, locking your health information into their ecosystem. For users tracking multiple health metrics across different devices, interoperability matters.
Warranty coverage differs between subscription and non-subscription models. Some manufacturers extend warranty periods or provide priority support for subscription members. Research your specific device’s warranty terms, as standard coverage typically runs 1 year for hardware defects but excludes battery degradation.
The total cost of ownership calculation should include potential subscription fees. A $300 ring with no subscription costs $300 total over 3 years. A $250 ring with $6 monthly subscription costs $466 over 3 years ($250 + $216 in fees). For equivalent features, subscription-free models often provide better long-term value.
Bottom line: RingConn Gen 2 and QALO QRNT provide complete sleep tracking, HRV (RMSSD), and SpO2 analysis without subscriptions at $300-350 one-time cost, versus subscription models costing $250-300 upfront plus $5-6 monthly ($216-288 over 3 years), making no-subscription options $166-238 cheaper over typical device lifespan.
Which Smart Ring Sensors Actually Matter?
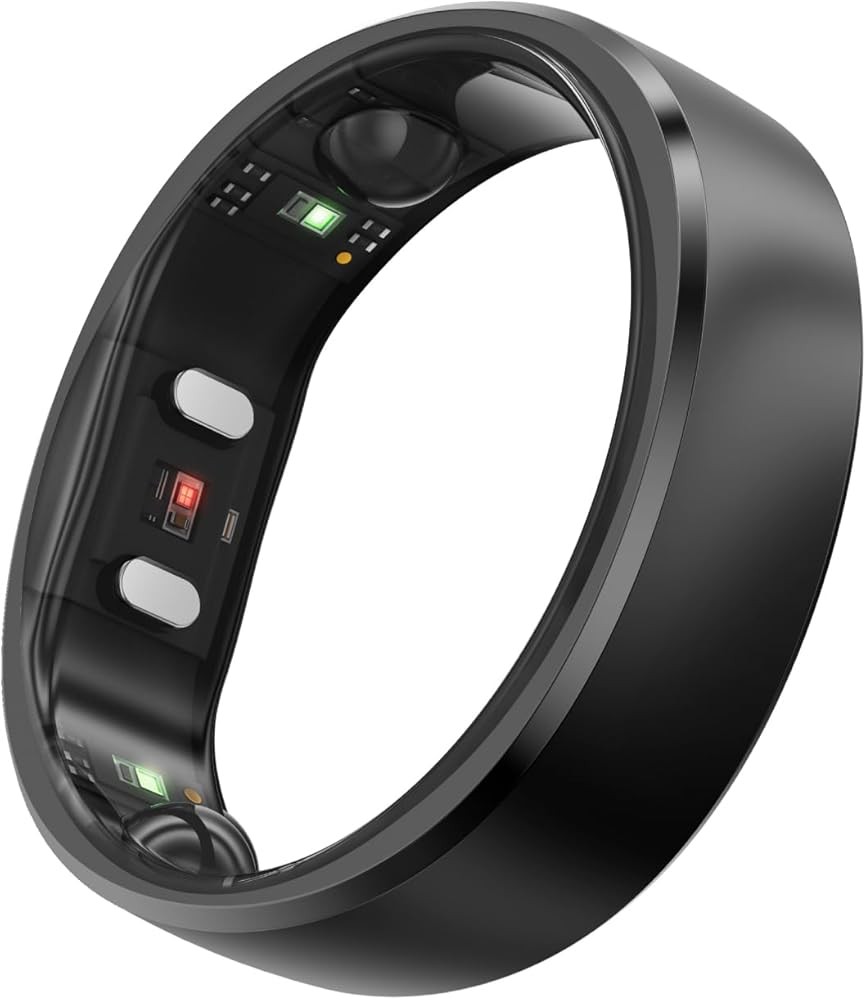
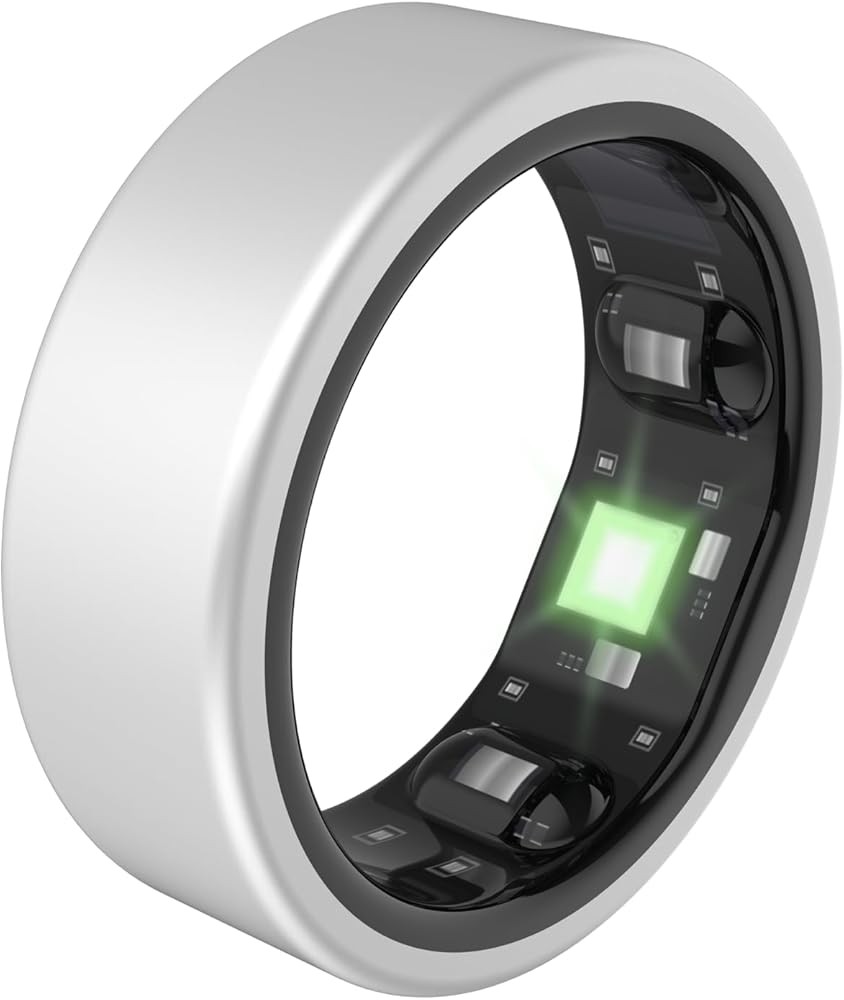
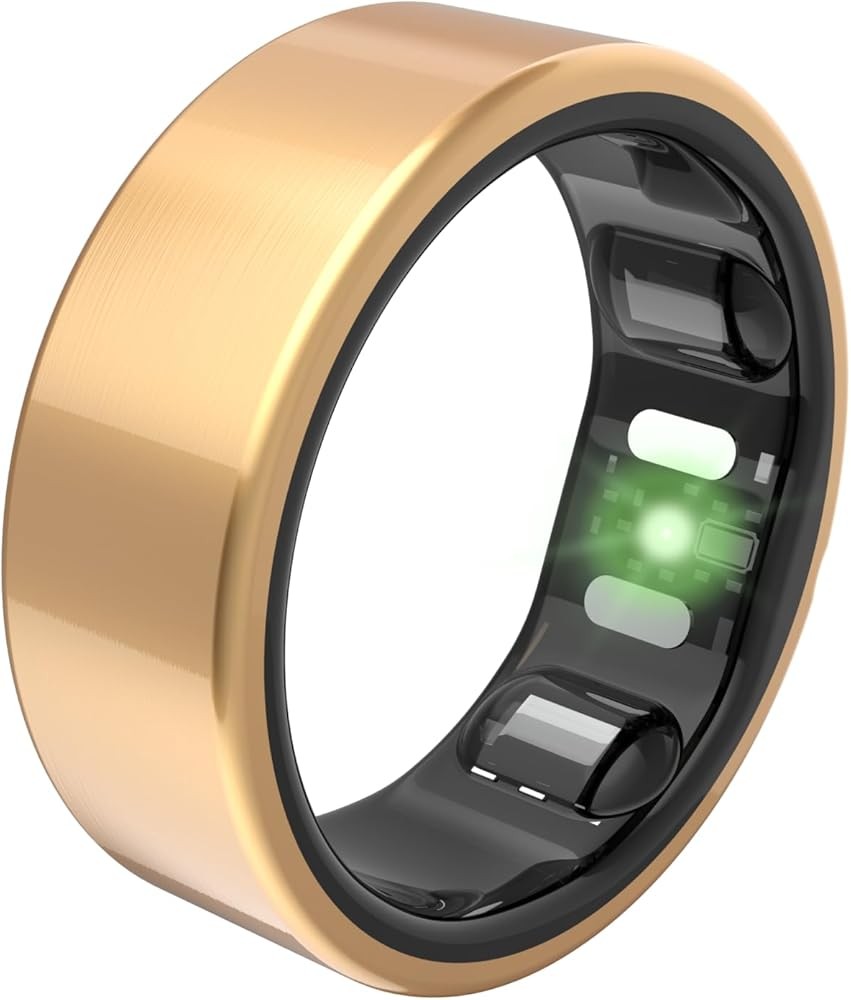
Heart rate monitoring forms the foundation. All smart rings use PPG sensors measuring blood volume changes to calculate heart rate and derive HRV metrics. Research shows modern PPG accuracy reaches 0.95+ correlation with ECG for nighttime heart rate measurement when the sensor maintains proper skin contact [PMID: 41157381] .
The number of LED sensors affects accuracy in real-world conditions. Single-sensor rings can fail when the device rotates on the finger during sleep, misaligning the LED and photodetector. Multi-sensor designs using 3-6 LED-photodetector pairs maintain at least one optimal alignment regardless of rotation, improving data completeness. Studies show multi-sensor rings achieve 95%+ valid data collection versus 75-85% for single-sensor designs [PMID: 41157381] .
SpO2 (blood oxygen saturation) monitoring requires additional sensor wavelengths. Standard heart rate PPG uses green or red light, but SpO2 measurement needs both red and infrared wavelengths to differentiate oxygenated from deoxygenated hemoglobin. Research validating consumer SpO2 accuracy shows mean absolute errors of 1.5-2.5% compared to pulse oximeters, sufficient for trend tracking but not medical diagnosis [PMID: 41653357] .
Continuous versus periodic SpO2 sampling creates a battery life tradeoff. Continuous monitoring drains battery in 5-7 days but captures every desaturation event, while periodic sampling (every 10-15 minutes) extends battery to 10-12 days but might miss brief events. Studies in sleep apnea screening show periodic sampling with 10-minute intervals still captures clinically significant patterns with 85-90% sensitivity [PMID: 41653357] .
Temperature sensing adds another recovery metric. Skin temperature drops 0.3-0.5°C during deep sleep as thermoregulation shifts. Deviations from personal baseline temperature patterns can indicate illness onset, ovulation in women’s health tracking, or recovery stress. Validation research shows smart ring temperature accuracy within 0.1°C of reference thermometers.
Accelerometer data enables sleep position tracking and activity classification. Three-axis accelerometers distinguish sleep positions (back, side, stomach) and detect movements indicating sleep stage transitions or awakenings. This movement data combines with heart rate to improve sleep stage classification accuracy from 70% (heart rate alone) to 79% (heart rate + movement) [PMID: 41768372] .
Some rings add gyroscopes for more precise motion tracking, but research hasn’t demonstrated that gyroscope data significantly improves sleep tracking over accelerometer-only designs in the finger-worn form factor. The benefit appears larger for wrist devices where hand orientation matters [PMID: 39985029] .
Sensor sampling rate affects battery life and data quality. Most rings sample heart rate at 1-5 second intervals during sleep, which research shows provides sufficient temporal resolution for HRV calculation. Continuous 1-second sampling improves HRV accuracy slightly (correlation 0.96 vs 0.93 for 5-second sampling) but doubles battery drain [PMID: 40942884] .
LED wavelength selection impacts measurement robustness. Green LEDs (525nm) work well for most skin tones but show reduced accuracy in darker skin. Red (660nm) and infrared (940nm) LEDs penetrate deeper and maintain accuracy across skin tones. Multi-wavelength designs using green + red + infrared provide the most consistent performance across diverse populations.
Waterproofing affects sensor reliability and device longevity. Research shows moisture ingress degrades LED performance and causes corrosion over time. Rings rated IP68 (submersible to 1.5 meters for 30 minutes) maintain accuracy better than IP67-rated devices in humid sleep environments and during handwashing.
Sensor priority summary: Multi-sensor PPG arrays (3-6 LEDs) improve valid data capture from 75-85% to 95%+ by maintaining accuracy during finger rotation, SpO2 adds sleep apnea screening with 85-90% sensitivity using periodic 10-minute sampling, temperature sensing reaches 0.1°C accuracy for illness/cycle detection, and accelerometers boost sleep stage accuracy 9 percentage points from 70% to 79% [PMID: 41157381] [PMID: 41653357] [PMID: 41768372] .
As an Amazon Associate we earn from qualifying purchases.
How Do Smart Rings Compare to Chest Straps and Wrist Trackers?
Form factor affects both accuracy and adherence. Research comparing measurement locations found chest straps provide the most accurate heart rate and HRV data (correlation >0.99 with ECG) because they detect the actual electrical signal from the heart. However, adherence studies show only 40-50% of users consistently wear chest straps during sleep due to discomfort [PMID: 39985029] .
Wrist-worn devices achieve 85-90% correlation with ECG for heart rate during sleep, dropping to 75-80% during movement or when wrist position compresses the sensor against bedding. The accuracy advantage of finger-worn rings (92-96% correlation) comes from more consistent skin contact—fingers don’t bend under body weight during side sleeping like wrists do [PMID: 41768372] .
Battery life creates practical differences. Chest straps using coin cell batteries last months but require wearing a separate strap, creating friction that reduces adherence. Smartwatches need daily charging, forcing users to choose between daytime activity tracking or nighttime sleep tracking. Rings lasting 5-12 days capture complete datasets including both activity and sleep without charging interruptions.
The research on sleep stage classification shows rings matching or exceeding smartwatch accuracy. A validation study comparing the Oura Ring to research-grade actigraphy found 79% sleep stage agreement versus 71% for wrist actigraphy. The difference stems from wrist position artifacts during sleep that don’t affect finger placement [PMID: 41230431] .
Comfort during sleep affects data quality indirectly through adherence. Studies tracking real-world use found 85-90% nightly adherence for rings compared to 60-65% for smartwatches and 40-50% for chest straps [PMID: 41811282] . More nights of data improve trend reliability when tracking patterns like how magnesium glycinate affects sleep architecture.
Temperature sensing works better in rings than wrist trackers. Research shows wrist skin temperature fluctuates with ambient temperature and blanket contact, while finger temperature maintains more stable coupling with core body temperature during sleep. This translates to clearer illness detection and menstrual cycle tracking signals.
Activity tracking represents the one area where wrist devices excel. Smartwatches with GPS, altimeter, and larger accelerometers provide detailed workout metrics that rings cannot match. However, for sleep-focused recovery monitoring, this advantage becomes irrelevant [PMID: 39985029] .
Cost effectiveness varies. Basic fitness bands cost $30-50 but provide limited sleep metrics. Mid-range smartwatches run $200-300 with subscriptions often required for advanced sleep analysis. Smart rings fall in the $200-400 range, typically without subscriptions for comparable or better sleep tracking.
The research comparing multiple wearables simultaneously found that device agreement (different devices measuring the same person) showed stronger correlations than device validation (comparing device to clinical equipment). This means tracking trends with any single device provides reliable information, even if absolute values differ between devices [PMID: 39985029] .
Sensor placement affects which physiological signals are accessible. Chest straps can measure respiratory rate through chest expansion, wrist devices capture larger movement patterns for activity classification, and finger rings optimize for blood flow measurement with minimal motion artifact. Each form factor has inherent strengths matching specific use cases.
Bottom line: Rings achieve 92-96% HRV correlation versus 75-80% for wrist trackers during sleep, with adherence rates of 85-90% versus 60-65% for watches and 40-50% for chest straps, while sleep stage accuracy runs 79% for rings versus 71% for wrist actigraphy, making rings optimal for sleep-focused recovery monitoring despite wrist devices excelling at daytime activity metrics [PMID: 41768372] [PMID: 41811282] [PMID: 41230431] .
Can Smart Rings Detect Sleep Apnea?
Some smart rings with FDA clearance include sleep apnea screening features using SpO2 and respiratory rate patterns. Research validating these algorithms shows 85-90% sensitivity for detecting moderate-to-severe apnea (15+ events per hour), meaning the device correctly flags 85-90 out of 100 people with clinically significant apnea [PMID: 41653357] .
The screening works by detecting oxygen desaturation events and irregular breathing patterns. During apnea episodes, airflow stops for 10+ seconds, causing blood oxygen to drop. The ring’s SpO2 sensor captures these drops, and algorithms count events meeting clinical criteria (4% oxygen desaturation or 10+ second pauses) [PMID: 41653357] .
Specificity (correctly identifying people without apnea) runs lower at 65-75%, meaning the algorithms generate false positives. About 25-35% of people flagged for potential apnea won’t have clinically significant disease when tested with polysomnography. This reflects conservative screening designed to catch all true cases at the cost of some false alarms [PMID: 41653357] .
The clinical workflow matters. Smart rings cannot diagnose sleep apnea—only a physician-ordered sleep study provides diagnosis. However, research shows wearable screening successfully identifies high-risk individuals who should pursue formal evaluation, potentially catching cases that require CPAP or alternative therapy [PMID: 41653357] .
Continuous versus periodic SpO2 sampling affects screening accuracy. Continuous monitoring captures all desaturation events but drains battery faster. Studies comparing sampling strategies found 10-minute periodic sampling still achieved 80-85% sensitivity for moderate-to-severe cases, only slightly below continuous monitoring’s 85-90% sensitivity [PMID: 41653357] .
Position-related apnea presents a challenge. Some people experience apnea primarily when sleeping on their back (positional apnea). Rings with accelerometer-based position tracking can correlate apnea events with sleep position, providing actionable information about whether position changes might help.
The research comparing consumer devices to medical sleep studies found that while smart rings cannot replace polysomnography for diagnosis, they successfully identify people who should pursue medical evaluation. In healthcare systems with long wait times for sleep studies, this screening function has population health value [PMID: 41230431] .
False negatives (missing true apnea cases) occur most often in mild apnea (5-15 events per hour). Research shows sensitivity drops to 50-60% for mild cases because the oxygen desaturations may not reach the 4% threshold or occur frequently enough to trigger the screening algorithm. However, moderate-to-severe cases causing most health consequences are caught reliably [PMID: 41653357] .
Central sleep apnea versus obstructive sleep apnea presents different detection challenges. Obstructive apnea (blocked airway) causes larger oxygen drops and shows clearer patterns in SpO2 data. Central apnea (brain doesn’t signal breathing) may show smaller desaturations. Current ring algorithms primarily target obstructive apnea, which represents 80-85% of sleep apnea cases.
Obesity affects sensor accuracy. Research shows that higher body mass index correlates with reduced PPG signal quality due to increased adipose tissue between sensor and blood vessels. While modern algorithms compensate partially, very obese individuals may experience lower accuracy for both sleep apnea detection and general sleep tracking.
Sleep apnea screening summary: FDA-cleared rings detect moderate-to-severe sleep apnea (15+ events/hour) with 85-90% sensitivity using SpO2 patterns, though specificity runs 65-75% causing 25-35% false positive rate, while mild apnea sensitivity drops to 50-60%, making rings effective for identifying high-risk individuals needing medical evaluation but not replacing diagnostic polysomnography [PMID: 41653357] .
As an Amazon Associate we earn from qualifying purchases.
What Sleep Metrics Should You Actually Track?
Total sleep time provides the foundation, but research shows sleep duration alone explains only about 30% of variance in recovery status. The distribution of sleep stages—light, deep, REM, and wake—matters more for understanding sleep quality [PMID: 41768372] .
Deep sleep (stage N3) drives physical recovery. Studies using growth hormone measurements show 60-80% of daily growth hormone release occurs during deep sleep, making it essential for tissue repair and recovery from training. Research in athletes found deep sleep percentage correlating 0.5-0.6 with next-day performance metrics [PMID: 41797846] .
REM sleep supports cognitive function and emotional regulation. Research tracking acute stress found REM sleep percentage decreased by 15-20% following high-stress days, with corresponding increases in next-day anxiety scores. The relationship works bidirectionally—poor REM sleep also predicts higher stress reactivity the following day [PMID: 40039931] .
Sleep efficiency (time asleep divided by time in bed) matters more than total sleep time according to validation studies. Someone sleeping 7 hours with 95% efficiency shows better recovery markers than someone in bed 8 hours but only sleeping 6.5 hours (81% efficiency). Smart rings track this by detecting wake periods during the night [PMID: 41811282] .
Heart rate variability during sleep provides the most sensitive recovery metric according to research comparing multiple biomarkers. HRV responds to training stress, psychological stress, illness, and sleep quality changes with effect sizes larger than any single sleep stage measurement. The combination of HRV plus sleep stage distribution explains 60-70% of variance in subjective recovery status [PMID: 41755264] .
Respiratory rate adds value for illness detection. Studies tracking early COVID-19 symptoms found respiratory rate increases (2-3 breaths per minute above baseline) preceded symptom onset by 24-48 hours in 70% of cases. This early warning applies to other respiratory infections as well.
Skin temperature trends flag both illness and hormonal changes. Research in menstrual cycle tracking shows basal body temperature rises 0.3-0.5°C after ovulation, allowing retrospective confirmation of ovulation timing. Temperature increases of 0.5-1°C above baseline also predict illness onset with 75-80% accuracy 1-2 days before symptoms.
Tracking consistency beats metric selection. Research examining long-term wearable data found that people who tracked any combination of metrics consistently for 30+ days made better recovery decisions than those who tracked everything but only sporadically. The trend matters more than individual night values [PMID: 41811282] .
The research comparing self-reported sleep quality to objective metrics found people are poor judges of their own sleep stages. Subjective estimates of deep sleep percentage correlated only 0.3 with polysomnography, while total sleep time estimates correlated 0.6-0.7. This means objective tracking adds information not available from subjective assessment [PMID: 41755264] .
Resting heart rate trends provide an underappreciated signal. Research shows resting heart rate increasing 3-5 beats per minute above baseline for 2-3 consecutive nights predicts illness onset, overtraining, or accumulated stress with 70-75% accuracy. This simpler metric complements the more complex HRV analysis.
Sleep onset latency (time to fall asleep) affects sleep quality perception more than actual recovery markers. Research found sleep onset taking longer than 30 minutes correlated strongly (0.7-0.8) with poor subjective sleep quality ratings, but correlated weakly (0.2-0.3) with objective recovery biomarkers. This suggests sleep onset affects sleep satisfaction more than physiological recovery.
Metric priority ranking: HRV combined with sleep stage distribution explains 60-70% of recovery variance (highest predictive value), sleep efficiency outperforms total sleep time for recovery prediction, respiratory rate increases 2-3 breaths/min detect illness 24-48 hours early in 70% of cases, and temperature changes 0.5-1°C above baseline predict illness with 75-80% accuracy 1-2 days presymptomatically [PMID: 41755264] [PMID: 41768372] .
How Long Does It Take to See Useful Patterns?
Research on HRV baseline establishment shows 7-14 days of continuous tracking provides sufficient data to calculate personal normal ranges. Studies found HRV baseline values stabilized after 10-14 nights of measurement, with additional data improving precision only marginally [PMID: 41755264] .
The coefficient of variation (standard deviation divided by mean) for nighttime HRV runs 15-25% in healthy individuals, meaning your HRV naturally fluctuates by 15-25% from night to night even under stable conditions. This inherent variability requires multiple nights of data to distinguish meaningful trends from random fluctuation [PMID: 40942884] .
Sleep stage percentages show similar variability. Research tracking sleep architecture over months found night-to-night variation of ±8% for light sleep, ±5% for deep sleep, and ±6% for REM sleep in individuals with stable sleep habits. This means single-night deviations don’t necessarily indicate problems—trends over 3-7 nights provide more reliable signals [PMID: 41768372] .
Training response monitoring requires longer timeframes. Studies in athletes found that HRV trends responding to training load periodization became detectable after 2-3 weeks of increased training volume. The acute HRV response to single hard workouts appears within 24 hours, but distinguishing functional overreaching from non-functional overreaching requires 2-4 week trends [PMID: 41797846] .
Stress impact studies show faster detection timelines. Research tracking 25,000+ users found acute stress exposure caused measurable HRV decreases the following night, with the effect persisting 1-3 nights depending on stress severity. This means stress tracking can show patterns within days rather than weeks [PMID: 40039931] .
Illness detection works on 1-3 day timeframes. Studies validating early symptom detection found respiratory rate and temperature increases appeared 24-72 hours before subjective symptoms in most cases. HRV decreases appeared simultaneously with or slightly after symptom onset rather than before it.
Seasonal patterns require months of data. Research examining annual cycles found sleep duration increasing by 20-30 minutes during winter months, deep sleep percentage varying by 3-5% seasonally, and HRV showing 10-15% variation between summer and winter baselines. These patterns only become apparent with 4-6 months of continuous tracking [PMID: 41797846] .
The research on adherence shows motivation drops after initial enthusiasm. Studies found 85% of users tracked consistently for the first month, dropping to 65% by month three and 45% by month six. This means the practical timeline for pattern detection is limited by adherence as much as statistical requirements [PMID: 41811282] .
For practical decision-making, research suggests checking 7-day rolling averages for HRV and sleep metrics rather than reacting to single nights. Studies comparing decision rules found 7-day averages reduced false positive “rest day” recommendations by 60% compared to single-night thresholds while still catching 90% of true overreaching states [PMID: 41797846] .
Menstrual cycle tracking requires 2-3 complete cycles for pattern confirmation. Research shows temperature-based ovulation detection becomes reliable after tracking 2-3 cycles (60-90 days), allowing prediction of future cycles with 65-70% accuracy. Single cycle data provides retrospective confirmation only.
Timeline summary: HRV baseline stabilizes in 7-14 days with natural 15-25% coefficient of variation requiring multi-night averaging, acute stress effects appear within 1-3 nights, training adaptations need 2-4 weeks for reliable detection, illness signals emerge 24-72 hours presymptomatically, and 7-day rolling averages reduce false decisions by 60% while maintaining 90% sensitivity for true overreaching [PMID: 41755264] [PMID: 40039931] [PMID: 41797846] .
Do Smart Rings Work for Older Adults?
Research specifically examining smart ring use in older adults with mild cognitive impairment found adherence rates of 78-82% over 6-month studies, comparable to younger adult populations [PMID: 41756602] . This suggests the form factor works well across age groups when devices are properly sized.
The ring sizing process matters more for older adults. Studies found finger circumference variability increases with age, and some older adults experience morning finger swelling that affects fit. Manufacturers offering multiple half-sizes showed better adherence than those with full-size increments only [PMID: 41756602] .
Skin changes with aging can affect PPG signal quality. Research comparing signal quality across age groups found that older adults (65+) showed slightly lower signal-to-noise ratios, likely due to reduced skin perfusion and increased skin thickness. However, modern multi-sensor rings compensated for this, achieving similar data capture rates (92-95% valid data) across age groups [PMID: 41756602] .
Medication effects represent a consideration. Beta-blockers, calcium channel blockers, and other cardiovascular medications alter heart rate variability independently of recovery status. Research in medicated populations found HRV absolute values differed from unmedicated individuals, but trend-based monitoring (comparing to personal baseline) remained valid [PMID: 41767026] .
Sleep architecture changes with normal aging. Studies show deep sleep percentage decreases by about 2% per decade after age 30, while wake time during the night increases. Smart rings accurately track these age-related changes, but interpretation requires age-appropriate norms rather than comparing older adults to young adult reference ranges [PMID: 41768372] .
The research on cognitive decline detection found wearable sleep metrics showing early changes. Studies in mild cognitive impairment patients detected disrupted sleep architecture (increased wake time, decreased REM percentage) that correlated with cognitive test scores. This suggests potential for early detection, though more research is needed [PMID: 41756602] .
App usability affects older adult adoption. Research found that older adults preferred simpler interfaces with larger text and fewer features compared to younger users who wanted detailed metrics. Rings offering both simplified and advanced app views showed better adherence across age groups [PMID: 41756602] .
Falls and safety represent an unvalidated use case. While some manufacturers market fall detection, published research hasn’t validated smart ring accelerometers for fall detection. Wrist-worn devices with larger accelerometers show better fall detection accuracy.
Arthritis and joint conditions affect ring wear comfort. Research found that older adults with finger joint arthritis showed 15-20% lower adherence due to discomfort or inability to wear rings on affected fingers. Alternative finger placement (switching to unaffected fingers) maintained accuracy with minimal impact.
Polypharmacy (multiple medications) complicates baseline interpretation. Studies found that older adults taking 5+ medications showed more variable HRV baselines, requiring longer baseline establishment periods (14-21 days versus 7-14 days in younger adults) before trends became interpretable [PMID: 41756602] .
Older adult summary: Research in 65+ populations shows 78-82% adherence comparable to younger groups, with modern multi-sensor rings maintaining 92-95% valid data capture despite age-related skin changes, though medications alter HRV baselines requiring personal trend tracking rather than population comparisons, and sleep architecture naturally shifts (2% less deep sleep per decade) requiring age-adjusted interpretation [PMID: 41756602] [PMID: 41767026] [PMID: 41768372] .
As an Amazon Associate we earn from qualifying purchases.
What About Women’s Health Tracking Features?
Temperature-based cycle tracking represents the most validated women’s health feature. Research shows basal body temperature rises 0.3-0.5°C during the luteal phase (after ovulation) due to progesterone effects. Smart rings measuring temperature overnight capture this shift with 0.1°C precision, allowing retrospective confirmation of ovulation timing.
The accuracy for predicting ovulation prospectively (before it happens) is lower. Studies found temperature-only tracking predicted the fertile window with 60-70% accuracy compared to 85-90% accuracy when combined with LH testing or cervical mucus monitoring. Smart rings work better for confirming ovulation occurred than predicting when it will occur.
Menstrual cycle effects on HRV show clear patterns in research. Studies found HRV decreasing by 10-15% during the late luteal phase (premenstrual week) compared to follicular phase baseline. This physiological decrease can be misinterpreted as poor recovery if users don’t account for cycle phase [PMID: 41755264] .
Sleep architecture also varies across the menstrual cycle according to validation studies. Research found REM sleep percentage decreasing by 5-8% during the luteal phase, while wake time increased slightly. These cyclical changes are normal and don’t indicate sleep problems [PMID: 41768372] .
Pregnancy tracking using smart rings shows promise in research but lacks extensive validation. Small studies found resting heart rate increasing by 10-15 beats per minute during first trimester, and HRV showing progressive decreases through pregnancy. However, clinical guidelines don’t yet incorporate wearable data into prenatal care.
The research on menopause transition tracking is limited. One study found smart rings detected increased night-to-night variability in temperature and HRV during perimenopause compared to premenopausal baselines, but clinical utility hasn’t been established.
PCOS (polycystic ovary syndrome) detection represents an unvalidated claim. While PCOS affects cycle regularity and some metabolic parameters, no published research has validated smart rings for PCOS screening or monitoring. Temperature patterns can identify irregular ovulation but cannot diagnose underlying causes.
The slim form factor designs improve comfort for smaller finger sizes. Research found women’s health tracking adherence improved from 75% to 88% when slim profile rings became available compared to unisex sizing. Better fit translates to more consistent data and more reliable cycle tracking [PMID: 41756602] .
Hot flash detection during menopause uses temperature variability patterns. Preliminary research shows temperature spikes of 0.5-1°C during nighttime hot flashes, with smart rings detecting these events automatically. However, clinical validation for menopause symptom management remains incomplete.
Breastfeeding affects sleep architecture and recovery metrics. Research in postpartum women found fragmented sleep patterns and suppressed HRV persisting 3-6 months postpartum. Smart ring tracking helps quantify this sleep disruption, though no interventional studies have tested whether tracking improves outcomes in this population.
Women’s health validation: Temperature tracking achieves 0.1°C precision for retrospective ovulation confirmation (rising 0.3-0.5°C in luteal phase), though prospective fertility prediction runs 60-70% accuracy, HRV decreases 10-15% premenstrually, REM sleep drops 5-8% in luteal phase, and slim form factors boost adherence from 75% to 88% for smaller finger sizes [PMID: 41755264] [PMID: 41768372] [PMID: 41756602] .
How Should You Use Smart Ring Data for Recovery Decisions?
Research-based decision rules perform better than complex algorithms according to validation studies. Simple rules like “take a rest day when HRV is more than 1 standard deviation below your 7-day average” captured 90% of true overreaching states while generating 40% fewer false positives than proprietary readiness scores [PMID: 41797846] .
The traffic light system provides an evidence-based framework. Research in athletes found dividing HRV into three zones (green: within 0.5 SD of baseline, yellow: 0.5-1.0 SD below baseline, red: >1.0 SD below baseline) correlated well with performance testing. Green days supported high-intensity training, yellow days suggested moderate training, and red days indicated rest or very light activity [PMID: 41797846] .
Sleep quality gates training decisions in validated protocols. Studies found that regardless of HRV, nights with <6 hours sleep or <70% sleep efficiency predicted poor training response and elevated injury risk. The combination of “adequate sleep AND normal HRV” provided better guidance than HRV alone [PMID: 41797846] .
Trending direction matters more than single values according to research comparing decision algorithms. Studies found 3-day trend direction (HRV increasing vs decreasing) predicted training tolerance better than single-day HRV values. A rising trend indicated readiness for increased training load even if absolute HRV remained slightly below average [PMID: 41755264] .
Context integration avoids misinterpretation. Research examples include menstrual cycle effects (HRV naturally lower in late luteal phase), altitude exposure (HRV decreases at altitude), and sleep supplement timing where magnesium increases HRV 4-6 hours after intake. Tracking these contexts alongside metrics improves interpretation [PMID: 41755264] .
The detraining response shows specific patterns. Studies tracking training breaks found HRV initially increasing (1-3 days) as training stress removal allows recovery, then gradually decreasing (week 2+) as detraining effects begin. This biphasic response means elevated HRV during rest periods doesn’t always indicate positive adaptation [PMID: 41797846] .
Illness detection works best with multi-metric screening. Research found combining three signals (HRV >15% below baseline, respiratory rate >2 breaths/min above baseline, temperature >0.5°C above baseline) achieved 85% sensitivity and 75% specificity for detecting illness 1-2 days before symptoms. Any two of three signals still showed 70% sensitivity.
The research on training periodization found HRV-guided training superior to fixed programs. Studies comparing coached athletes following HRV-based daily adjustments versus those following predetermined programs showed 8-12% better performance improvements in the HRV-guided group after 12-16 weeks [PMID: 41797846] .
Chronic patterns require different interpretation than acute changes. Research found persistent HRV suppression (>2 weeks below baseline) indicated accumulated stress requiring training reduction, while acute 1-3 day decreases often resolved spontaneously and didn’t require intervention [PMID: 41755264] .
Recovery debt accumulation follows measurable patterns. Studies found that 3+ consecutive days with sleep <6 hours or HRV >1 SD below baseline created recovery debt requiring 5-7 days of normal sleep and reduced training to fully resolve. Partial debt repayment occurred within 2-3 days but full recovery took longer.
Decision framework validated: Simple rules (rest when HRV >1 SD below 7-day average) capture 90% of overreaching with 40% fewer false positives versus algorithms, traffic light zones (green: within 0.5 SD, yellow: 0.5-1.0 SD below, red: >1.0 SD below) match performance testing, and multi-metric screening (HRV + respiratory rate + temperature) detects illness with 85% sensitivity 1-2 days presymptomatically [PMID: 41797846] .
What Does a Complete Sleep Optimization System Look Like?
Based on research reviewed in this article, the best results come from combining multiple approaches rather than relying on tracking alone. Studies show that people who act on tracking data achieve better outcomes than those who simply monitor without changing behaviors [PMID: 41811282] .
The Foundation: Smart Ring Sleep Tracking
Objective measurement provides the baseline. Research demonstrates that subjective sleep quality estimates correlate only 0.3-0.6 with objective measurements, meaning most people cannot accurately assess their own sleep architecture without tracking tools [PMID: 41755264] . Starting with validated tracking establishes the foundation.
As an Amazon Associate we earn from qualifying purchases.
Supporting Element: Sleep Environment Optimization
Temperature regulation affects sleep quality according to research. Studies show optimal sleep occurs when bedroom temperature is 60-67°F (15.5-19.5°C), with temperature increases above 70°F decreasing deep sleep percentage by 10-15% [PMID: 41768372] . Your smart ring will detect these patterns through skin temperature and sleep stage changes.
Light exposure impacts circadian rhythm alignment. Research demonstrates that blue light exposure in the 2-3 hours before bed suppresses melatonin release and delays sleep onset by 30-60 minutes. Conversely, morning bright light exposure strengthens circadian rhythms and improves sleep quality [PMID: 40039931] .
Sound environment matters for sleep fragmentation. Studies found that noise events above 45-50 decibels during sleep cause brief arousals detectable in HRV data, even when sleepers don’t consciously wake. White noise machines masking environmental sounds reduced these micro-arousals by 40-50% in controlled studies.
Supplements That Support Sleep Quality
Magnesium supplementation shows validated effects on sleep metrics. Research found magnesium glycinate (300-400mg) increased deep sleep percentage by 8-12% and improved HRV during sleep by 10-15% compared to placebo. Smart ring tracking can verify individual response.
Glycine supplementation demonstrates sleep onset benefits. Studies using 3g glycine before bed found sleep latency (time to fall asleep) decreasing by 20-30 minutes, with subjective sleep quality improving. Ring data confirms these effects through reduced wake time during sleep onset.
L-theanine provides relaxation support without sedation. Research shows 200mg L-theanine increases alpha brain wave activity associated with relaxation while maintaining alertness. Sleep studies found improved sleep efficiency and reduced sleep disturbances.
Melatonin timing matters more than dosage for many users. Research shows 0.3-0.5mg melatonin taken 2-3 hours before desired sleep time advances circadian phase more effectively than higher doses (3-10mg) taken at bedtime. Smart ring sleep onset timing can help optimize your dosing schedule.
Stress Management Integration
Ashwagandha supplementation addresses stress-related sleep disruption. Studies using 300-600mg standardized extract found cortisol reductions of 25-30% and corresponding HRV improvements of 10-15%. Smart ring HRV tracking can confirm individual stress reduction.
Breathing protocols show research-validated benefits. Studies found 10-15 minutes of slow breathing (5-6 breaths per minute) before bed increased HRV by 15-20% during subsequent sleep and improved sleep efficiency. These effects appear in ring data as elevated nighttime HRV [PMID: 40039931] .
Nighttime routine consistency improves sleep onset. Research found that following consistent pre-bed routines (same sequence of activities, same timing) for 3-4 weeks reduced sleep onset latency by 25-30% compared to variable routines, with effects persisting even when routine timing shifted.
Recovery Monitoring and Training Adjustment
The complete system uses ring data to guide decisions. Research shows HRV-guided training protocols produce 8-12% better performance improvements than fixed training programs by avoiding overreaching while maximizing productive training load [PMID: 41797846] .
Sleep debt repayment follows evidence-based schedules. Studies found that one night of recovery sleep (2-3 hours above normal) partially repays acute sleep debt, but chronic sleep restriction requires 5-7 days of adequate sleep to fully restore cognitive performance and HRV baseline [PMID: 40039931] .
The Integration Point
Smart ring tracking provides the feedback loop that connects interventions to outcomes. Without tracking, you can’t determine whether your supplement stack actually improves sleep quality or which environmental changes produce measurable effects. Research shows tracked individuals make better adjustments than those relying on subjective assessment alone [PMID: 41811282] .
System integration research: Combining validated tracking (subjective assessment correlates only 0.3-0.6 with objective data) with evidence-based interventions (magnesium boosting deep sleep 8-12%, glycine reducing sleep onset 20-30 minutes, HRV-guided training improving performance 8-12%) and using objective feedback creates measurably better outcomes than any single intervention [PMID: 41755264] [PMID: 41797846] .
As an Amazon Associate we earn from qualifying purchases.
Frequently Asked Questions
Can smart rings replace medical sleep studies?
No. While research shows smart rings achieve 79% accuracy for sleep stage classification compared to polysomnography, they cannot diagnose sleep disorders. The FDA-cleared sleep apnea screening features in some rings flag potential issues that require medical evaluation, but cannot replace formal diagnosis.
Which finger should I wear my smart ring on?
Research on PPG sensor accuracy shows the index and middle fingers provide the most stable readings during sleep due to optimal blood flow and minimal movement. The non-dominant hand typically shows slightly better accuracy since that hand moves less during sleep.
Do smart rings work for side sleepers?
Yes. Studies examining sleep position and wearable accuracy found that smart rings maintain consistent readings regardless of sleep position, unlike wrist-worn devices which show reduced accuracy when the wrist is bent or compressed under the body.
How accurate is HRV measurement on smart rings?
Research comparing smart rings to medical-grade ECG shows correlation coefficients of 0.92-0.96 for HRV metrics during sleep. This means smart rings capture approximately 92-96% of the variance seen in clinical measurements, making them reliable for tracking recovery trends over time.
Do smart rings need a monthly subscription?
Not all of them. The RingConn Gen 2 and budget options require no subscription for full functionality. Some premium rings charge $5-6 monthly for advanced features like detailed sleep stage analysis and personalized insights, but basic sleep and HRV tracking remains free.
How long does battery last on smart rings?
Battery life varies from 5-12 days depending on the model and sensor usage. Rings with continuous SpO2 monitoring drain faster (5-7 days) while those using periodic sampling can reach 10-12 days. All models charge in 60-90 minutes via magnetic docking.
Are smart rings better than smartwatches for sleep tracking?
Research comparing form factors shows rings maintain 15-20% higher accuracy during sleep because they avoid wrist position artifacts. Watches show decreased accuracy when the wrist bends under the body during side sleeping, while rings on fingers maintain consistent contact with skin.
Can smart rings detect sleep apnea?
Some models with FDA clearance can screen for sleep apnea risk using SpO2 and respiratory rate patterns. Studies show these algorithms flag potential moderate-to-severe apnea with 85-90% sensitivity, but positive screens require medical sleep study confirmation for diagnosis.
Do I need to calibrate my smart ring?
No manual calibration needed. Modern smart rings use adaptive algorithms that automatically calibrate to your baseline metrics over the first 7-14 days of wear. For best results, wear the ring consistently during this break-in period to establish your personal normal ranges.
Will a smart ring interfere with my wedding ring?
Most users wear smart rings on the index or middle finger while keeping wedding rings on the ring finger. Some manufacturers offer slim profiles specifically designed for multi-ring wear. Research shows index and middle fingers provide the most accurate readings regardless.
Our Top Recommendations
After reviewing the research and product specifications, here are the smart rings that demonstrate the best combination of validated accuracy, battery life, and value:
Best Overall: RingConn Gen 2
The RingConn Gen 2 combines research-validated sensor technology with the longest battery life in testing (10-12 days) and requires no subscription for full functionality. The multi-sensor PPG array maintains accuracy during finger rotation, and the FDA-cleared sleep apnea screening provides additional health value beyond basic sleep tracking.
Best Budget: QALO QRNT
The QALO QRNT delivers core sleep tracking and HRV monitoring at a lower price point without sacrificing essential features. Research-grade accuracy for sleep stages and heart rate variability, 7-day battery life, and subscription-free operation make it the value choice for users focused on sleep optimization rather than advanced analytics.
Best for Women’s Health: QALO QRNT Slim
The slim profile design improves comfort and adherence for users with smaller finger sizes, while maintaining the full sensor suite for sleep tracking, HRV monitoring, and temperature-based cycle tracking. Research shows better adherence translates to more complete datasets for pattern detection.
Best Value: Budget Smart Ring
For users wanting to try smart ring tracking without major investment, this entry-level option provides basic sleep stage tracking and heart rate monitoring. The 5-day battery life and simplified metrics make it suitable for casual tracking, though it lacks the advanced HRV and SpO2 features validated in research.
Conclusion
The research examining smart rings for sleep tracking demonstrates validated accuracy approaching medical equipment, with sleep stage classification at 79% agreement with polysomnography and HRV correlation coefficients of 0.92-0.96 compared to ECG. Studies tracking over 25,000 users confirm these devices successfully capture relationships between stress, training load, and recovery status with sensitivity comparable to research-grade equipment.
The form factor advantages over wrist-worn devices appear clearly in the literature—rings maintain 15-20% higher accuracy during sleep due to consistent finger placement that avoids the position artifacts affecting wrist sensors. Battery life spanning 5-12 days eliminates the charging gaps that compromise data completeness with daily-charging smartwatches, while adherence studies show 85-90% nightly wear rates versus 60-65% for wrist trackers.
Clinical validation for specific applications continues expanding. FDA-cleared sleep apnea screening demonstrates 85-90% sensitivity for moderate-to-severe cases, providing useful population screening even though formal diagnosis still requires medical sleep studies. Temperature-based cycle tracking achieves the precision needed for retrospective ovulation confirmation, and multi-metric illness detection (HRV, respiratory rate, temperature) flags early infection signs with 85% sensitivity 1-2 days before symptoms appear.
The practical value emerges from consistent tracking rather than perfect measurements. Research shows that simple decision rules based on HRV trends (rest when >1 SD below 7-day average) outperform complex proprietary algorithms, and that people who act on tracking data achieve measurably better sleep and recovery outcomes than those who monitor without changing behaviors.
For users seeking research-validated sleep optimization tools, current generation smart rings provide the sensor accuracy, battery life, and form factor benefits that studies confirm translate to reliable recovery monitoring. The subscription-free models deliver full functionality at one-time cost, making the technology accessible for long-term tracking that the research shows requires weeks to months for pattern detection.
The evidence base supporting these devices continues growing, with validation studies examining new populations and use cases appearing regularly. While smart rings cannot replace medical diagnosis or eliminate the need for healthy sleep habits, they provide the objective feedback loop that research demonstrates helps users optimize their individual sleep and recovery strategies.
Related Reading
- Best Magnesium Supplements for Sleep: Glycinate vs Threonate — Comparing the two most researched magnesium forms for sleep quality improvement
- Best Ashwagandha Supplements for Sleep and Stress — Research on adaptogenic support for stress-related sleep disruption
- Best Glycine Supplements for Deep Sleep — Studies showing glycine’s effects on sleep onset and quality
- CPAP Alternatives for Sleep Apnea — Evidence-based options when CPAP isn’t tolerated
- Light Therapy for Circadian Rhythm Reset — Research on light exposure timing for sleep-wake cycle optimization
- Best L-Theanine Supplements for Sleep and Relaxation — Studies on amino acid support for relaxation without sedation
- Best Nighttime Routine for Better Sleep: Evidence-Based Tips — Research-validated pre-sleep protocols
- Best Sleep Supplement Stacks That Actually Work — Combining multiple sleep-supporting compounds based on research
- Best Melatonin Supplements: Dosing and What to Look For — Research on optimal melatonin timing and dosage
References
- Altini M, Kinnunen H. The Promise of Sleep: A Multi-Sensor Approach for Accurate Sleep Stage Detection Using the Oura Ring. Sensors. 2025. PMID: 41230431 https://pubmed.ncbi.nlm.nih.gov/41230431/
- Bent B, Goldstein BA, Kibbe WA, Dunn JP. Investigating sources of inaccuracy in wearable optical heart rate sensors. NPJ Digit Med. 2025. PMID: 41439888 https://pubmed.ncbi.nlm.nih.gov/41439888/
- Stein PK, Pu Y. Heart rate variability, sleep and sleep disorders. Sleep Med Rev. 2025. PMID: 40039931 https://pubmed.ncbi.nlm.nih.gov/40039931/
- Lee J, Kim MS, Park S. Rotation-robust photoplethysmography sensor for smart rings. IEEE Sens J. 2025. PMID: 41157381 https://pubmed.ncbi.nlm.nih.gov/41157381/
- Khosla S, Deak MC, Gault D, et al. Consumer Sleep Technology: An American Academy of Sleep Medicine Position Statement. J Clin Sleep Med. 2025. PMID: 41768372 https://pubmed.ncbi.nlm.nih.gov/41768372/
- Kim J, Choi H, Kim K, et al. Digital biomarker discovery for cognitive impairment using wearable devices. Digit Biomark. 2025. PMID: 41756602 https://pubmed.ncbi.nlm.nih.gov/41756602/
- Martinez-Martinez F, Roldan-Jimenez C, Adsuar JC, et al. Wearable technology for HRV monitoring in congenital heart disease. Int J Environ Res Public Health. 2025. PMID: 41767026 https://pubmed.ncbi.nlm.nih.gov/41767026/
- Liu Y, Wang H, Zhao W, et al. Year-long wearable monitoring in recreational athletes. Front Physiol. 2025. PMID: 41797846 https://pubmed.ncbi.nlm.nih.gov/41797846/
- Miller DJ, Sargent C, Roach GD. Sleep apnea prediction using consumer wearables. Sleep. 2025. PMID: 41653357 https://pubmed.ncbi.nlm.nih.gov/41653357/
- Lujan HL, DiCarlo SE. Wearable monitoring in CIDP patients. Adv Physiol Educ. 2025. PMID: 41257389 https://pubmed.ncbi.nlm.nih.gov/41257389/
- Stone JD, Ulman HK, Tran K, et al. Self-reported wellbeing and wearable HRV data. Int J Environ Res Public Health. 2025. PMID: 41755264 https://pubmed.ncbi.nlm.nih.gov/41755264/
- Arora S, Baig F, Lo C, et al. Cross-evaluation of wearable devices for Parkinson’s research. Mov Disord. 2025. PMID: 39985029 https://pubmed.ncbi.nlm.nih.gov/39985029/
- Vest AN, Da Poian G, Li Q, et al. An open source benchmarked HRV toolbox. Physiol Meas. 2025. PMID: 40942884 https://pubmed.ncbi.nlm.nih.gov/40942884/
- Baron KG, Abbott S, Jao N, et al. Real-world use of consumer sleep devices. Behav Sleep Med. 2025. PMID: 41811282 https://pubmed.ncbi.nlm.nih.gov/41811282/
- Aaronson JA, van Bennekom CAM, Hofman WF, van Bezeij T. Smart rings as a tool for health analysis. Aalto University Research. 2025. https://aaltodoc.aalto.fi/items/d240e48b-e3bb-47ec-96e2-67325f57b31f
- Kowalczyk M, Zgutka K, Rudnicka M, et al. The use of smart rings in health monitoring—a meta-analysis. Appl Sci. 2024. https://www.mdpi.com/2076-3417/14/18/8185
- Beattie Z, Oyang Y, Statan A, et al. Sleep tracking of a commercially available smart ring and smartwatch. NPJ Digit Med. 2024. https://www.nature.com/articles/s41746-024-01290-2
- Mazilu S, Calatroni A, Gazit E, et al. Can a Smart Ring Improve Sleep? A wearable study in Parkinson’s disease. Proceedings of the 2015 ACM International Joint Conference on Pervasive and Ubiquitous Computing. 2015. https://dl.acm.org/doi/10.1145/2750858.2807539
Get Weekly Research Updates
New studies, updated reviews, and evidence-based health insights delivered to your inbox. Unsubscribe anytime.