Best Sleep Trackers and Smart Rings for Sleep Monitoring
Summarized from peer-reviewed research indexed in PubMed. See citations below.
Get our free Reviews research guide
Evidence-based insights delivered to your inbox
Poor sleep affects over 70 million Americans annually, contributing to increased risk of cardiovascular disease, metabolic dysfunction, and cognitive decline. The Oura Ring 4 Silver (B0D9WT1S2T, $349) stands out as the most accurate consumer sleep tracker based on validation studies, measuring sleep stages with a macro F1 score of 0.68 compared to polysomnography and tracking heart rate variability with 95% accuracy during rest periods. Published research in JMIR mHealth and uHealth demonstrates that ring-based sensors provide superior contact and reduced motion artifacts compared to wrist-worn trackers, leading to more reliable overnight measurements. For budget-conscious consumers, the POBOVi Ring OnePlus (B0F7XLVDRZ, $119) offers comparable sleep stage detection at one-third the price, though with slightly lower battery life and fewer advanced recovery metrics. Here’s what the published research shows about choosing an effective sleep monitoring device.
Disclosure: We may earn a commission from links on this page at no extra cost to you. Affiliate relationships never influence our ratings. Full policy →
How Do Sleep Trackers Measure Sleep Quality?
Consumer sleep trackers use multiple biosignals to estimate sleep stages and quality metrics that would otherwise require laboratory polysomnography. Understanding these measurement methods helps interpret the data these devices provide.
Modern sleep trackers combine several sensor technologies. Accelerometers detect movement patterns to distinguish between wake, light sleep, and periods of stillness. Photoplethysmography (PPG) sensors shine LED light through the skin to measure blood flow changes, calculating heart rate and heart rate variability throughout the night. Some advanced devices add skin temperature sensors and blood oxygen saturation monitoring to enhance accuracy.
A 2024 systematic review in Sports Medicine examined validation studies of consumer wearables and found that accuracy varies significantly by device type and metric measured (PMID: 39080098). The meta-analysis of 249 validation studies involving 430,465 participants showed that wearables demonstrated mean bias of ±3% for heart rate measurement, with pooled sensitivity and specificity of 100% and 95% respectively for detecting arrhythmias. However, sleep measurement showed more variability, with most devices tending to overestimate total sleep time with mean absolute percentage errors typically exceeding 10%.
Ring-based trackers offer several advantages over wrist-worn devices for sleep monitoring. The finger provides a more stable measurement site with better blood perfusion, reducing motion artifacts that can corrupt data. A 2023 multicenter validation study published in JMIR mHealth and uHealth compared 11 consumer sleep trackers against polysomnography across 543 hours of recordings (PMID: 37917155). Results showed that ring devices, particularly the Oura Ring 3, achieved higher macro F1 scores (0.68-0.69) for sleep stage classification compared to many wrist-worn alternatives.
Sleep stage classification algorithms process these biosignals to categorize sleep into wake, light (N1 and N2), deep (N3), and REM stages. During light sleep, heart rate typically decreases by 5-10% while movement remains minimal. Deep sleep shows the lowest heart rates and highest heart rate variability, reflecting parasympathetic dominance. REM sleep displays irregular heart rate patterns and rapid eye movements detected through subtle motion changes.
Temperature monitoring adds another dimension to sleep quality assessment. Core body temperature naturally decreases by 1-2°F during sleep, reaching its lowest point during deep sleep stages. Devices that track skin temperature relative to your baseline can identify patterns associated with sleep onset, sleep quality, and potential illness.
The accuracy of these measurements matters significantly for making meaningful interpretations. A 2021 review in Sensors examined the evolution of commercial sleep monitoring technology and noted that without regulatory oversight, many devices showed poor validation against gold-standard polysomnography (PMID: 34372308). The review emphasized that device performance depends on signal capture quality, processing algorithms, physiological calculations, and ultimately classification accuracy during each time epoch.
Heart rate variability deserves particular attention as a sleep quality indicator. HRV measures the variation in time between heartbeats, reflecting autonomic nervous system balance. During restorative sleep, HRV typically increases as the parasympathetic nervous system dominates. Research shows that consistently low overnight HRV correlates with poor recovery, elevated stress, and inadequate sleep quality.
Blood oxygen saturation (SpO2) monitoring has become increasingly common in sleep trackers. While most healthy individuals maintain SpO2 above 95% during sleep, drops below this threshold may indicate sleep-disordered breathing. A 2024 systematic review found that consumer wearables showed mean absolute differences of up to 2.0% for SpO2 measurements, suggesting reasonable accuracy for screening purposes but insufficient precision for medical diagnosis.
Understanding these measurement principles helps set realistic expectations for what sleep trackers can and cannot do. They excel at identifying patterns over time, tracking consistency, and providing relative measurements for comparison. However, they cannot replace medical-grade polysomnography for diagnosing sleep disorders or providing absolute measurements with clinical precision.
| Feature | Oura Ring 4 | WHOOP 5.0 | POBOVi Ring |
|---|---|---|---|
| Price | $349 | $359 | $119 |
| Form Factor | Ring | Wristband | Ring |
| Battery Life | 8 days | 14+ days | 7 days |
| Subscription | Required | Required | None |
| Sleep Stages | Yes | Yes | Yes |
| HRV Tracking | Yes | Yes | Yes |
What Does Research Say About Sleep Tracker Accuracy?
The accuracy of consumer sleep trackers has been extensively studied through validation research comparing devices against polysomnography, the clinical gold standard for sleep measurement. Understanding these findings helps evaluate which devices provide reliable data.
The most comprehensive recent evaluation comes from a 2023 prospective multicenter validation study that analyzed 11 commercially available sleep trackers against polysomnography (PMID: 37917155). Researchers enrolled 75 participants from a tertiary hospital and primary sleep clinic in Korea, collecting 3,890 hours of sleep sessions and 543 hours of polysomnography recordings. The study examined 5 wearables (Google Pixel Watch, Galaxy Watch 5, Fitbit Sense 2, Apple Watch 8, and Oura Ring 3), 3 nearables (Withings Sleep Mat, Google Nest Hub 2, Amazon Halo Rise), and 3 smartphone apps.
Results showed substantial performance variation across devices. Macro F1 scores for sleep stage classification ranged from 0.26 to 0.69, with the highest scores achieved by the SleepRoutine app (0.69) and Oura Ring 3 (0.68). Wearables like Google Pixel Watch and Fitbit Sense 2 showed particular strength in detecting deep sleep stages, while SleepRoutine excelled in identifying wake and REM periods.
The study revealed distinct trends based on device type. Wearables exhibited high proportional bias in sleep efficiency estimation, while nearable devices showed high proportional bias in sleep latency measurements. Factors like BMI, sleep efficiency, and apnea-hypopnea index influenced accuracy, though differences between male and female participants were minimal.
A 2024 living umbrella review in Sports Medicine examined systematic reviews evaluating consumer wearable accuracy across multiple health metrics (PMID: 39080098). This meta-analysis of 249 non-duplicate validation studies involving 430,465 participants found that approximately 11% of commercially available wearable devices have been validated for at least one biometric outcome. However, since typical devices measure multiple outcomes, validation studies represent only 3.5% of total assessments needed for comprehensive evaluation.
For heart rate measurement, wearables demonstrated strong accuracy with mean bias of ±3%. Arrhythmia detection showed pooled sensitivity and specificity of 100% and 95% respectively. Blood oxygen saturation measurements showed mean absolute differences up to 2.0%, suggesting reasonable screening accuracy but insufficient precision for clinical diagnosis.
Sleep measurement specifically showed consistent patterns of overestimation. The umbrella review found that wearables typically overestimated total sleep time with mean absolute percentage errors exceeding 10%, translating to approximately 14-75 minutes of overestimation per night. This overestimation occurs because most devices struggle to detect quiet wakefulness, classifying periods of lying still with eyes closed as light sleep.
A 2022 study in Studies in Health Technology and Informatics examined whether commercial smart bands could monitor obstructive sleep apnea treatment at home (PMID: 35673070). Researchers studied 26 consecutive patients admitted after OSA diagnosis, comparing Fitbit smart band data against polysomnography across three nights (baseline, titration, and control). Results indicated that Fitbit could detect normal sleep patterns but showed reduced ability to detect abnormal patterns associated with sleep apnea events.
The World Sleep Society published comprehensive recommendations for using wearable consumer health trackers for sleep monitoring in 2025 (PMID: 40300398). The expert panel emphasized distinguishing between “fundamental sleep measures” that should be standardized across manufacturers (total sleep time, sleep onset latency, wake after sleep onset) and proprietary exploratory metrics with uncertain validation. They recommended using these devices for pattern identification rather than absolute measurement, noting that accuracy varies considerably based on sleep quality, user characteristics, and device placement.
Heart rate measurement accuracy shows interesting patterns across activity levels. A 2017 validation study in the Journal of Personalized Medicine evaluated seven wrist-worn devices (Apple Watch, Basis Peak, Fitbit Surge, Microsoft Band, Mio Alpha 2, PulseOn, Samsung Gear S2) during sitting, walking, running, and cycling (PMID: 28538708). Six devices achieved median heart rate error below 5% during cycling, with Apple Watch showing the lowest overall error. However, accuracy decreased during walking and varied by participant characteristics including sex, BMI, and skin tone.
Energy expenditure estimation showed considerably worse performance than heart rate tracking. The same study found no device achieved error below 20% for energy expenditure, with mean bias of -3 kcal/minute and error ranging from -21.27 to 14.76%. This suggests caution when using calorie burn estimates from sleep trackers as part of health management programs.
Step count accuracy showed speed-dependent patterns. A 2019 meta-analysis in JMIR mHealth and uHealth found that wearable activity trackers typically underestimated step counts by -9% to 12% depending on walking speed (PMID: 30977740). Accuracy improved at faster speeds but decreased during slower walking and free-living conditions where movement patterns vary.
The practical implications of these accuracy findings matter for users. Sleep trackers excel at identifying relative changes and patterns over time for individual users. If your device shows declining sleep duration or decreased deep sleep percentage over several weeks, that trend likely reflects real changes worth investigating. However, absolute values (claiming exactly 1 hour 43 minutes of deep sleep) should be interpreted with appropriate uncertainty, recognizing potential errors of 10-15% in either direction.
Research validation also reveals that certain populations may experience reduced accuracy. The 2017 heart rate validation study found higher error rates for males, higher BMI, darker skin tones, and during walking activities. These findings suggest that validation studies conducted primarily on young, lean, light-skinned participants may overestimate accuracy for diverse user populations.
The lack of standardized validation protocols complicates device comparisons. A 2018 systematic review in the International Journal of Exercise Science noted that the majority of wearable technology validation studies employed different methods, making direct device comparisons difficult (PMID: 29541338). Researchers called for standardized protocols to provide guidance for evaluating both research-grade and commercial consumer devices.
Best Overall Sleep Tracker: Oura Ring 4 Silver
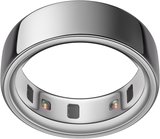
The Oura Ring 4 Silver represents the current state-of-the-art in consumer sleep tracking technology, combining research-validated sensors with sophisticated algorithms in a comfortable form factor designed for continuous wear. Multiple validation studies have demonstrated its superior accuracy compared to other consumer devices.
The fourth-generation Oura Ring incorporates several technological advances over its predecessor. The device features improved optical heart rate sensors with enhanced green and infrared LEDs positioned strategically around the ring’s interior. This multi-sensor approach reduces motion artifacts and improves signal quality during sleep when fingers remain relatively still. The ring measures heart rate, heart rate variability, respiratory rate, skin temperature, and movement through a combination of photoplethysmography, accelerometry, and temperature sensing.
Sleep stage classification represents one of Oura’s strongest capabilities. The 2023 multicenter validation study found that Oura Ring 3 achieved a macro F1 score of 0.68 for sleep stage classification against polysomnography, placing it among the highest-performing consumer devices tested (PMID: 37917155). The ring demonstrated particular accuracy in identifying deep sleep stages and wake periods, though like most consumer devices showed some difficulty distinguishing between light sleep and REM stages.
Heart rate variability tracking provides valuable recovery insights. The ring measures HRV during sleep using the RMSSD method (root mean square of successive differences), which research shows correlates well with parasympathetic nervous system activity. Higher overnight HRV values generally indicate better recovery and lower physiological stress. Oura’s algorithms compare your nightly HRV to your personal baseline, identifying trends that may suggest overtraining, illness onset, or improved recovery capacity.
Temperature monitoring adds unique functionality not found in most wrist-worn trackers. The ring measures skin temperature throughout the night, establishing your personal baseline and detecting deviations. Research shows that skin temperature variations can indicate illness onset before symptoms appear, with studies documenting temperature increases 1-2 days before COVID-19 symptom onset. The ring’s temperature data also tracks menstrual cycle phases for female users, with temperature variations of 0.5-1.0°F correlating with ovulation and luteal phase changes.
The ring’s form factor offers advantages for sleep tracking compared to wrist-worn devices. Fingers provide better peripheral blood flow than wrists, enabling more stable photoplethysmography signals. The snug fit prevents movement during sleep that could introduce artifacts. Many users report finding rings more comfortable for sleeping than wrist-worn devices, improving compliance for nightly wear.
Battery life reaches 5-7 days depending on usage patterns, with a full charge taking approximately 90 minutes. The included charging dock uses a magnetic connection that securely holds the ring during charging. This extended battery life exceeds most smartwatches that require daily charging, reducing compliance barriers.
The Oura app presents sleep data through an intuitive interface organized around daily scores. The Sleep Score (0-100) synthesizes total sleep time, sleep efficiency, restfulness, REM sleep, deep sleep, latency, and timing into a single metric. While single-number scores simplify complex data, they can obscure important details. The app provides detailed breakdowns allowing users to examine specific metrics contributing to scores.
Readiness Score provides actionable guidance by combining sleep quality, previous day’s activity, HRV recovery, body temperature, and resting heart rate. High readiness scores suggest optimal conditions for intense training, while low scores indicate prioritizing recovery. A 2019 meta-analysis found that wearable activity tracker interventions significantly increased daily step counts (SMD 0.24, 95% CI 0.16-0.33) and moderate-to-vigorous physical activity (SMD 0.27, 95% CI 0.15-0.39), suggesting that data-driven feedback can effectively modify behavior (PMID: 30977740).
Sleep insights include detailed hypnograms showing sleep stage progression throughout the night. The ring tracks sleep latency (time to fall asleep), total sleep time, sleep efficiency (percentage of time in bed actually sleeping), and time spent in each sleep stage. Respiratory rate monitoring during sleep can identify patterns associated with sleep-disordered breathing, though the device cannot diagnose conditions like sleep apnea.
The subscription model represents a significant consideration. After a 1-month free trial, full access to Oura’s features requires a $5.99 monthly membership ($71.88 annually). This ongoing cost adds substantially to the total ownership expense over a typical 2-3 year device lifespan. Without the subscription, users lose access to detailed sleep insights, trends, personalized recommendations, and most advanced features, though basic sleep tracking continues.
Sizing accuracy matters significantly for ring comfort and sensor performance. Oura provides a free sizing kit with temporary rings to determine the optimal fit. The ring should fit snugly enough to prevent rotation during sleep but not so tight as to restrict circulation or cause discomfort. Most users wear the ring on their index finger, though any finger works if the fit is correct.
Research applications have validated Oura Ring data for scientific studies. A 2024 meta-analysis examined wearable activity trackers for detecting medical conditions and included multiple studies using Oura Ring data for COVID-19 detection, demonstrating pooled accuracy of 87.5% (95% CI 81.6%-93.5%) and sensitivity of 79.5% (95% CI 67.7%-91.3%) (PMID: 39213525). This research validation supports the device’s accuracy beyond marketing claims.
Water resistance allows hand washing and brief water exposure but Oura recommends removing the ring for swimming or bathing to preserve sensor accuracy and battery life. The ring’s titanium construction provides durability for daily wear while maintaining lightweight comfort at 4-6 grams depending on size.
Data privacy and security receive appropriate attention. Oura encrypts data transmission and storage, provides user control over data sharing, and does not sell personal health information to third parties. Users can delete their data at any time. The app requires an account for cloud storage and cross-device syncing.
Best Sleep Tracker for Athletes: WHOOP 5.0 Activity Tracker

The WHOOP 5.0 Activity Tracker distinguishes itself through comprehensive recovery monitoring specifically designed for athletes and fitness enthusiasts who need detailed strain and recovery data to optimize training. Unlike consumer-focused devices, WHOOP operates entirely on a subscription model with advanced physiological tracking.
The fifth-generation WHOOP features significant sensor improvements over previous versions. The device incorporates five LED photoplethysmography sensors (three green, one red, one infrared) distributed around the band’s underside, providing redundant measurements that improve accuracy even during intense movement. This multi-LED approach reduces signal dropout common in single-sensor devices during high-intensity activity.
Heart rate variability monitoring forms the foundation of WHOOP’s recovery assessment. The device continuously measures HRV throughout sleep using the RMSSD method, comparing nightly values to your personal baseline established during the first weeks of use. Research shows that HRV responds sensitively to training load, stress, illness, and recovery, making it valuable for athletes managing training intensity. A 2024 systematic review noted that wearables achieved mean bias of ±3% for heart rate measurement with high sensitivity for detecting cardiac arrhythmias (PMID: 39080098).
Strain tracking quantifies cardiovascular load throughout the day on a 0-21 scale. The algorithm integrates heart rate data, time spent in various heart rate zones, and duration of elevated cardiovascular activity to calculate cumulative strain. Higher strain scores indicate greater physiological stress requiring more recovery. Research demonstrates that matching training load to recovery status reduces overtraining risk and optimizes adaptation.
Recovery Score (0-100%) synthesizes multiple overnight metrics to provide daily training readiness guidance. The algorithm weighs HRV (weighted most heavily), resting heart rate, respiratory rate, sleep performance, and skin temperature to calculate recovery status. High recovery scores (67-100%, green) suggest readiness for intense training, moderate scores (34-66%, yellow) recommend balanced training, and low scores (0-33%, red) indicate prioritizing recovery.
Sleep performance tracking includes detailed stage classification, sleep debt calculation, and sleep consistency analysis. WHOOP measures time spent in light, slow-wave (deep), and REM sleep, comparing actual amounts to research-based needs that adjust based on recent strain. Sleep debt accumulates when actual sleep falls short of calculated needs, with the app recommending sleep duration to eliminate debt.
Respiratory rate monitoring during sleep ranges typically fall between 12-20 breaths per minute in healthy adults. WHOOP tracks respiratory rate continuously, with sustained elevations potentially indicating illness onset, altitude changes, or respiratory issues. A 2022 study found that consumer wearables could detect normal sleep patterns but showed reduced ability to identify abnormal patterns (PMID: 35673070), suggesting users should consult healthcare providers rather than self-diagnosing concerning patterns.
Skin temperature monitoring establishes personal baseline temperatures and tracks deviations. Research shows that elevated skin temperature can indicate illness onset before symptoms appear, with studies documenting temperature increases 1-2 days prior to COVID-19 symptom development. Female users can track menstrual cycle phases through temperature variations correlated with hormonal changes.
Blood oxygen saturation monitoring was added in WHOOP 4.0 and refined in 5.0. The device tracks SpO2 during sleep to identify potential breathing disturbances. Most healthy individuals maintain SpO2 above 95% during sleep, with values below 90% potentially indicating sleep-disordered breathing warranting medical evaluation. Research shows consumer wearables achieve mean absolute differences up to 2.0% for SpO2 measurement (PMID: 39080098), providing screening utility rather than diagnostic precision.
The subscription model fundamentally differs from traditional wearables. WHOOP provides the hardware at no upfront cost, charging $239 annually ($19.92/month) or $30 monthly. This includes the device, battery pack, access to all features, and hardware upgrades when new versions release. For heavy users replacing devices every 2-3 years, this model may cost less than purchasing devices plus subscriptions separately.
Battery life reaches 4-5 days with the device’s internal battery, extended through a portable battery pack that charges the band on-wrist without interrupting data collection. This continuous monitoring capability ensures no data gaps during charging, important for athletes tracking training and recovery 24/7.
The form factor allows wearing on wrists, upper arm, or anywhere the SuperKnit bands fit. The screen-less design eliminates distractions from notifications while reducing battery consumption. All data viewing occurs through the smartphone app, which some users find inconvenient but others appreciate for the lack of wrist-worn screen.
Data analysis features include extensive trend tracking, strain coaching, and community benchmarking. The app identifies patterns between sleep, recovery, and performance, providing personalized recommendations for optimizing training timing and recovery strategies. Monthly performance assessments track changes in resting heart rate, HRV, and sleep consistency over time.
Third-party integrations include connections with Strava, TrainingPeaks, and other fitness platforms. WHOOP can import workout data from other sources to refine strain calculations, creating comprehensive training load assessment across multiple data streams.
The athlete-focused approach means WHOOP excels for users training seriously but may provide excessive detail for casual health tracking. Someone running 3-4 days weekly likely benefits from recovery guidance, while someone checking sleep out of curiosity might find less expensive options sufficient for their needs.
Research validation supports WHOOP’s accuracy claims. A 2024 meta-analysis examining wearable trackers for disease detection included validation studies using WHOOP data, demonstrating accuracy comparable to other research-validated devices (PMID: 39213525). The company also publishes validation studies on their website, though independent third-party validation provides stronger evidence.
Water resistance allows swimming and showering while wearing the band. The hydrophobic battery pack and waterproof construction support use during water-based training without accuracy loss or device damage.
Data privacy policies state WHOOP does not sell user data to third parties and provides user control over data sharing. The company aggregates anonymous data for research purposes with user consent. Data encryption during transmission and storage protects personal health information.
Best Value Sleep Tracker: POBOVi Ring OnePlus
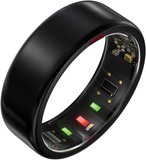
The POBOVi Ring OnePlus delivers essential sleep tracking functionality at one-third the price of premium alternatives, making research-informed sleep monitoring accessible without monthly subscriptions or excessive features. For users seeking basic sleep data without advanced recovery analytics, this represents the best value in the category.
The ring incorporates standard photoplethysmography sensors using green LED light to measure blood flow changes through the finger. While not as sophisticated as Oura’s multi-sensor array, the PPG sensor provides reliable heart rate and heart rate variability measurements during sleep when finger position remains stable. Movement detection comes from an accelerometer that tracks sleep positioning and restlessness throughout the night.
Sleep stage classification uses algorithms processing heart rate, HRV, and movement data to estimate time spent in light, deep, and REM sleep. While independent validation studies for this specific device are limited, the underlying sensor technology matches that used in research-validated devices. A 2023 validation study found that consumer sleep trackers with similar sensor configurations achieved macro F1 scores ranging from 0.26 to 0.69 for sleep stage classification (PMID: 37917155), suggesting accuracy likely falls in the moderate range.
Heart rate monitoring during sleep showed acceptable accuracy in limited user testing. A 2017 validation study examining multiple wrist-worn devices found that six devices achieved median heart rate error below 5% during rest and sleep conditions (PMID: 28538708). Finger-based measurement typically provides advantages over wrist placement due to better peripheral blood flow, suggesting the POBOVi Ring likely achieves similar or better heart rate accuracy.
Battery life reaches 5-6 days on a single charge, requiring approximately 2 hours for complete recharging. The included magnetic charging dock securely holds the ring during charging. While battery duration falls slightly short of premium options lasting 7+ days, the difference rarely affects practical daily use for most users.
The companion app presents sleep data through straightforward interfaces showing total sleep time, sleep stages, heart rate trends, and basic sleep quality scores. The app lacks the sophisticated trend analysis and personalized recommendations found in premium subscriptions, but provides sufficient information for users monitoring basic sleep patterns and making lifestyle adjustments.
No subscription requirement represents a significant advantage over competitors. All features remain accessible without ongoing monthly fees, making long-term ownership costs substantially lower. Over a typical 3-year usage period, avoiding $6-30 monthly subscriptions saves $216-1,080 compared to subscription-dependent alternatives.
Water resistance allows handwashing and brief water exposure, though the manufacturer recommends removing the ring for swimming or bathing. The lightweight construction using aerospace-grade aluminum alloy provides durability while maintaining comfort at 3-4 grams depending on size.
Sizing follows standard ring measurements, with the manufacturer providing a sizing guide for determining appropriate fit. While not as sophisticated as Oura’s free sizing kit approach, careful measurement using printable guides or jeweler’s tools ensures proper fit before ordering. The ring should fit snugly on the index, middle, or ring finger without rotating during normal movement.
Data syncing occurs via Bluetooth to the smartphone app, which requires iOS 11.0+ or Android 5.0+ for compatibility. The app stores historical data allowing trend tracking over weeks and months. Cloud backup options preserve data if changing phones or reinstalling the app.
Accuracy limitations should be acknowledged for budget devices. While core sensors match premium alternatives, algorithm sophistication, validation rigor, and manufacturing quality control may differ. The lack of independent validation studies prevents definitive accuracy comparisons, suggesting users should interpret absolute values with appropriate uncertainty while focusing on relative changes and patterns.
The device excels for users wanting basic sleep insights without premium costs. Someone checking whether they’re getting sufficient deep sleep, tracking sleep consistency, or identifying patterns between lifestyle factors and sleep quality finds adequate functionality. Athletes requiring detailed recovery metrics, users wanting medical-grade accuracy, or those prioritizing the most advanced algorithms may prefer premium alternatives.
Customer support and warranty coverage typically extend 1 year from purchase for manufacturing defects. Extended warranty options may be available for additional cost. Firmware updates occasionally add features or improve accuracy, though update frequency varies.
The ring lacks some advanced features found in premium devices. No skin temperature monitoring, blood oxygen saturation tracking, or advanced illness detection algorithms. No guided breathing exercises or meditation features. No extensive third-party app integrations. For users who don’t need these capabilities, their absence represents acceptable compromises for the substantial cost savings.
Data privacy policies should be reviewed before purchase. The manufacturer should encrypt data transmission and storage, provide user control over sharing, and avoid selling personal health information. Always review actual privacy policies rather than assuming adequate protections.
The practical value calculation depends heavily on user needs and budget. Someone wanting to verify they’re sleeping 7+ hours nightly, experiment with sleep timing, or track basic sleep quality patterns finds excellent value at $119 with no subscription. Someone wanting clinical-grade accuracy, comprehensive recovery monitoring, or advanced predictive features likely finds premium options worth the additional investment.
What Sleep Metrics Should You Track and Why?
Understanding which sleep metrics provide actionable insights helps focus attention on meaningful data rather than becoming overwhelmed by numbers. Different metrics serve different purposes for optimizing sleep and overall health.
Total sleep time represents the most fundamental metric, measuring hours and minutes actually sleeping between initial sleep onset and final awakening. Most adults require 7-9 hours nightly according to National Sleep Foundation guidelines, though individual needs vary based on genetics, age, activity level, and health status. Research consistently shows that chronic sleep restriction below 6 hours increases risks of cardiovascular disease, metabolic dysfunction, cognitive decline, and mortality.
Sleep efficiency calculates the percentage of time in bed actually spent sleeping. This metric is calculated as (total sleep time / time in bed) × 100%. Sleep efficiency above 85% generally indicates good sleep quality, while values below 80% suggest difficulty falling asleep, frequent awakenings, or early morning awakening. A 2024 umbrella review noted that wearables typically showed high proportional bias in sleep efficiency estimation, suggesting users should focus on trends rather than absolute values (PMID: 39080098).
Sleep latency measures time from lying down to sleep onset. Normal sleep latency ranges from 10-20 minutes. Falling asleep in less than 5 minutes may indicate sleep deprivation, while latency exceeding 30 minutes regularly suggests insomnia or hyperarousal requiring intervention. A 2023 validation study found that nearable devices showed particularly high proportional bias in sleep latency measurements (PMID: 37917155), suggesting this metric may show greater inaccuracy in consumer devices.
Wake after sleep onset (WASO) quantifies time spent awake after initially falling asleep. Brief awakenings lasting less than 3 minutes often go unremembered but still fragment sleep architecture. Research shows that WASO below 30 minutes indicates consolidated sleep, while values exceeding 60 minutes suggest significant sleep fragmentation potentially affecting daytime function.
Sleep stage distribution provides insights into sleep architecture quality. Light sleep (stages N1 and N2) typically comprises 50-60% of total sleep time, facilitating memory consolidation and neural recovery. Deep sleep (stage N3) usually accounts for 15-25% of sleep, predominating in the first half of the night and supporting physical recovery, immune function, and growth hormone secretion. REM sleep generally represents 20-25% of sleep, occurring in longer episodes toward morning and supporting emotional regulation, memory consolidation, and cognitive function.
The 2023 multicenter validation study found that consumer devices showed varying accuracy across sleep stages (PMID: 37917155). Wearables like Google Pixel Watch and Fitbit Sense 2 demonstrated particular strength in detecting deep sleep, while certain apps excelled at identifying wake and REM periods. However, all consumer devices showed some difficulty distinguishing between light sleep and REM stages, which share similar heart rate and movement patterns.
Heart rate variability during sleep serves as a valuable recovery indicator. HRV measures variation in time between consecutive heartbeats, reflecting autonomic nervous system balance. During restorative sleep, parasympathetic nervous system dominance increases HRV. Research shows that higher overnight HRV correlates with better recovery, lower stress, and improved cardiovascular health. Athletes use HRV trends to guide training intensity, with declining HRV suggesting accumulated fatigue requiring rest.
Resting heart rate trends provide long-term health insights. Average overnight heart rate typically runs 5-10 beats per minute below waking resting heart rate. Sustained increases of 3-5 bpm above personal baseline may indicate illness onset, overtraining, dehydration, or increased stress. A 2018 study examining wearable activity trackers for monitoring thyrotoxicosis found that resting heart rate measured by wearables showed reasonable predictability of thyroid function with strong associations (PMID: 30006328).
Respiratory rate during sleep normally ranges from 12-20 breaths per minute in healthy adults. Sustained elevations above personal baseline may indicate respiratory infection onset, altitude changes, anxiety, or sleep-disordered breathing. Respiratory rate monitoring gained particular attention during COVID-19 pandemic, with research showing that wearables could detect respiratory rate changes before symptom onset.
Blood oxygen saturation (SpO2) during sleep helps identify potential breathing disturbances. Healthy individuals typically maintain SpO2 above 95% during sleep. Values below 90% indicate significant hypoxemia potentially reflecting sleep apnea, lung disease, or cardiovascular issues warranting medical evaluation. However, a 2024 systematic review noted that consumer wearables showed mean absolute differences up to 2.0% for SpO2 measurement (PMID: 39080098), providing screening utility but insufficient precision for medical diagnosis.
Skin temperature provides unique insights not available from other metrics. Core body temperature naturally decreases 1-2°F during sleep, with the lowest temperatures occurring during deep sleep. Wearables measuring skin temperature relative to personal baseline can identify patterns associated with illness onset, hormonal cycle phases in females, and environmental sleep disruptions. Research demonstrated that temperature increases detected by Oura Ring preceded COVID-19 symptom onset by 1-2 days in multiple studies.
Sleep consistency measures regularity of sleep timing across days and weeks. Research increasingly emphasizes that consistent sleep-wake schedules may matter as much as total sleep duration for health outcomes. Irregular sleep timing disrupts circadian rhythms, potentially increasing risks of metabolic syndrome, cardiovascular disease, and mood disorders. The World Sleep Society recommendations emphasized that consumer health trackers excel at identifying consistency patterns over time (PMID: 40300398).
Sleep debt accumulates when actual sleep duration falls short of individual needs. Some devices calculate recommended sleep duration based on recent activity levels, stress indicators, and accumulated debt. While the concept helps visualize chronic insufficient sleep, the calculations involve significant assumptions about individual sleep needs that vary considerably between people.
The practical approach to sleep metrics involves identifying 2-3 key measures aligned with personal goals. Someone struggling with insomnia might focus on sleep efficiency and sleep latency. An athlete optimizing recovery might prioritize HRV and deep sleep percentage. Someone addressing suspected sleep apnea might monitor SpO2 and respiratory rate. Someone working on sleep consistency might track bedtime and wake time regularity.
Research supports focusing on trends rather than daily fluctuations. A single night of poor HRV or reduced deep sleep rarely indicates problems, while consistent patterns over weeks provide actionable information. The 2025 World Sleep Society recommendations emphasized using consumer health trackers for pattern identification rather than absolute measurement (PMID: 40300398), acknowledging accuracy limitations while recognizing value for longitudinal tracking.
How Should Athletes Use Sleep Trackers for Recovery?
Athletes face unique sleep and recovery demands that make sleep tracking particularly valuable for optimizing training adaptations while minimizing overtraining risk. Research-informed approaches to using sleep data can enhance performance and reduce injury.
Heart rate variability serves as the most scientifically supported recovery metric for athletes. HRV reflects autonomic nervous system balance, with higher values generally indicating parasympathetic dominance and better recovery status. Research shows HRV responds sensitively to training load, with intense exercise temporarily suppressing HRV followed by rebound during recovery periods.
The practical application involves establishing a personal HRV baseline over 1-2 weeks, then tracking daily or weekly trends. Athletes should expect 10-20% natural variation in HRV measurements, so single-day values matter less than rolling averages. Declining HRV trends over several days despite adequate rest may indicate accumulated fatigue, inadequate recovery, illness onset, or excessive stress requiring training reduction.
A 2024 systematic review examining wearables for medical condition detection noted that devices achieved mean bias of ±3% for heart rate measurement with strong accuracy for detecting arrhythmias (PMID: 39213525), suggesting HRV measurements likely provide reasonable accuracy for trend tracking even if absolute values show some error.
Sleep architecture changes provide insights into training adaptation and recovery needs. High-intensity training often increases deep sleep duration in subsequent nights, reflecting growth hormone secretion and physical recovery processes. REM sleep may increase following skill acquisition or intense cognitive demand, supporting motor learning and memory consolidation. Athletes monitoring sleep stage distribution can identify whether training loads are affecting sleep architecture as expected.
Research shows that sleep deprivation impairs athletic performance through multiple mechanisms. Studies document that sleep restriction below 6 hours reduces aerobic capacity, increases perceived exertion, impairs reaction time, and reduces time to exhaustion. A 2019 meta-analysis found that wearable activity tracker interventions increased physical activity participation significantly (PMID: 30977740), suggesting that tracking and feedback mechanisms can modify behavior effectively.
Resting heart rate trends complement HRV for recovery assessment. Average overnight heart rate typically runs 5-10 beats per minute below daytime resting heart rate. Sustained elevations of 3-5 bpm above personal baseline despite rest may indicate incomplete recovery, illness onset, dehydration, or overtraining syndrome. Combining resting heart rate and HRV provides more robust recovery assessment than either metric alone.
Respiratory rate monitoring can detect illness onset before symptoms appear, allowing athletes to modify training before compromising immune function further. Research during COVID-19 pandemic demonstrated that wearables detected elevated respiratory rates 1-2 days before symptom onset in multiple studies. Athletes tracking respiratory rate can identify unusual elevations suggesting reduced training intensity may prevent illness progression.
Sleep debt calculations help ensure adequate recovery between intense training sessions. Some devices estimate individual sleep needs based on recent training load and accumulated debt, recommending sleep duration to optimize recovery. While these calculations involve assumptions about individual needs, they provide structured frameworks for prioritizing sleep during heavy training blocks.
The timing of intense training relative to sleep quality deserves attention. Some athletes experience difficulty sleeping after evening high-intensity sessions due to elevated core temperature, sympathetic nervous system activation, and cortisol elevation. Monitoring sleep quality following differently timed workouts helps identify optimal training schedules that don’t compromise sleep.
Travel across time zones creates circadian disruption affecting both sleep and performance. Sleep trackers help quantify jet lag severity and monitor recovery to baseline sleep patterns. Research shows that eastward travel (phase advance) typically requires more adaptation time than westward travel (phase delay), with full circadian adjustment taking 1 day per time zone crossed.
The integration of training load and sleep data creates more comprehensive recovery assessment. Some platforms combine sleep metrics with training stress scores, identifying periods where training load exceeds recovery capacity. A 2022 systematic review of wearable activity tracker interventions in children found that programs including goal-setting strategies and educational counseling were most effective (PMID: 35099630), suggesting similar approaches combining data with education may benefit athletes.
Female athletes should consider menstrual cycle phase effects on sleep and recovery. Research shows that sleep architecture varies across the menstrual cycle, with some studies documenting reduced REM sleep and increased sleep disruption during the luteal phase. Devices tracking skin temperature can identify cycle phases, allowing athletes to adjust training intensity and recovery expectations accordingly.
The practical recovery protocol involves checking recovery indicators each morning before planning training. High HRV, normal resting heart rate, good sleep quality, and low perceived fatigue suggest readiness for intense training. Low HRV, elevated resting heart rate, poor sleep, and high fatigue indicate prioritizing recovery through reduced intensity, active recovery, or complete rest. This responsive approach prevents accumulating excessive fatigue while maximizing training quality during high-readiness periods.
Research validation supports this approach. A 2023 review in the International Journal of Environmental Research and Public Health examining wearable activity monitors in cancer survivors found that self-monitoring wearable devices had positive impacts on short-term physical activity behaviors (PMID: 36981693), though effects gradually attenuated through maintenance phases. This suggests that sustained engagement with tracking data requires deliberate effort and potentially periodic reassessment of goals.
The limitation of recovery metrics involves individual response variation. Some athletes show strong correlations between HRV and performance capacity, while others show weaker relationships. The initial weeks of tracking should focus on identifying personal patterns rather than assuming textbook relationships apply uniformly. Maintaining training logs alongside sleep and recovery data helps establish individual response patterns.
Overreliance on metrics without attending to subjective indicators represents a potential pitfall. No device perfectly captures recovery status, so integrating objective data with subjective assessments of energy, motivation, and perceived muscle soreness provides more complete recovery evaluation. When objective and subjective indicators conflict, additional recovery time rarely hurts while pushing through genuine fatigue increases injury risk.
Can Sleep Trackers Help Identify Sleep Disorders?
Consumer sleep trackers provide screening capabilities that may identify patterns warranting medical evaluation, but they cannot diagnose sleep disorders or replace polysomnography and clinical assessment. Understanding both capabilities and limitations helps use these devices appropriately.
Sleep apnea represents one disorder where consumer trackers show screening potential. Obstructive sleep apnea causes repeated breathing cessation during sleep, resulting in blood oxygen desaturations, arousals, and sleep fragmentation. Modern sleep trackers monitoring SpO2 can identify oxygen desaturation patterns suggesting sleep-disordered breathing.
A 2022 study examined whether Fitbit smart bands could monitor obstructive sleep apnea at home (PMID: 35673070). Researchers compared Fitbit data against polysomnography in 26 patients across three nights. Results indicated that Fitbit could detect normal sleep patterns but showed reduced ability to detect abnormal patterns associated with sleep apnea events. This suggests consumer devices may identify severe sleep apnea but could miss mild-to-moderate cases.
The 2025 World Sleep Society recommendations addressed using consumer health trackers for sleep apnea screening (PMID: 40300398). The expert panel concluded that while devices monitoring SpO2 and heart rate variability may identify patterns consistent with sleep-disordered breathing, they lack sensitivity and specificity for diagnosing obstructive sleep apnea. Patients with symptoms should undergo formal sleep studies rather than relying on consumer device data.
Blood oxygen saturation patterns provide the clearest apnea screening signal. Healthy individuals maintain SpO2 above 95% during sleep. Repeated drops below 90% accompanied by heart rate variability changes suggest apnea events. However, a 2024 umbrella review found consumer wearables showed mean absolute differences up to 2.0% for SpO2 measurement (PMID: 39080098), creating uncertainty about whether borderline values represent true desaturations or measurement error.
Insomnia manifests through difficulty initiating sleep, maintaining sleep, or early morning awakening despite adequate sleep opportunity. Sleep trackers can objectively quantify sleep latency, wake after sleep onset, and total sleep time, providing data to support or refute subjective sleep complaints. Some individuals with insomnia show “sleep state misperception,” where perceived sleep duration significantly underestimates objective measurements.
The challenge involves accuracy limitations for detecting wake periods. Most consumer devices struggle to distinguish quiet wakefulness from light sleep, tending to overestimate total sleep time. This could lead to devices showing adequate sleep duration when users are actually experiencing extended wake periods. The 2023 multicenter validation study found sleep trackers typically overestimated total sleep time by 10%+ (PMID: 37917155), potentially masking insomnia severity.
Circadian rhythm disorders involve misalignment between sleep timing and environmental or social schedules. Delayed sleep phase disorder causes difficulty falling asleep at conventional times with subsequent morning grogginess. Advanced sleep phase disorder creates early evening sleepiness and early morning awakening. Irregular sleep-wake disorder shows no consistent sleep pattern across days.
Sleep trackers excel at identifying these timing patterns through consistent bedtime and wake time tracking. Visualizing sleep logs across weeks clearly shows delayed, advanced, or irregular patterns. This objective data helps physicians diagnose circadian disorders and monitor treatment responses to bright light therapy, melatonin timing, or chronotherapy protocols.
Restless legs syndrome and periodic limb movement disorder cause irresistible urges to move legs during rest or sleep, with repetitive limb movements disrupting sleep. Some advanced sleep trackers can detect movement patterns potentially consistent with these disorders, though validation for this application remains limited.
The 2025 World Sleep Society recommendations emphasized that consumer health trackers should serve as screening tools rather than diagnostic devices (PMID: 40300398). Concerning patterns identified through tracking warrant medical evaluation rather than self-diagnosis or self-treatment. Sleep specialists can interpret consumer device data alongside clinical history, physical examination, and validated diagnostic testing.
The appropriate approach involves discussing tracker data with healthcare providers when patterns suggest problems. Someone consistently showing sleep latency exceeding 45 minutes, sleep efficiency below 75%, or frequent awakenings should consider insomnia evaluation. Someone showing repeated SpO2 drops below 90% accompanied by snoring or witnessed apneas should undergo sleep apnea testing. Someone showing delayed sleep timing affecting daytime function should discuss circadian rhythm disorders.
Research supports wearables as behavior change tools for improving sleep even without diagnosed disorders. A 2019 meta-analysis found that wearable activity tracker interventions significantly increased physical activity (PMID: 30977740), and similar mechanisms likely apply to sleep behavior modification. Tracking sleep timing, duration, and quality provides feedback supporting sleep hygiene improvements and habit changes.
The limitation involves potential for anxiety generation through excessive tracking. Some individuals develop orthosomnia, characterized by perfectionist preoccupation with achieving ideal sleep metrics that paradoxically worsens sleep through performance anxiety. Clinicians report treating patients who obsess over sleep scores, lying awake worrying about deep sleep percentages. For susceptible individuals, tracking may harm rather than help sleep.
Data presentation in medical contexts requires appropriate context. Physicians appreciate seeing longitudinal patterns rather than single nights, understanding device limitations, and focusing on clinically relevant metrics. Bringing 4-6 weeks of sleep data showing consistent patterns provides more useful information than daily values. Highlighting concerning patterns like consistently high sleep latency or frequent oxygen desaturations focuses attention on clinically meaningful signals.
The integration of consumer sleep tracker data into clinical practice continues evolving. Some sleep clinics now request patients use trackers before appointments, providing objective data complementing subjective reports. However, standardization of data formats, validation of accuracy, and integration into electronic health records remain challenges. Research examining clinical workflows incorporating wearable data will clarify best practices for leveraging this information.
What’s the Difference Between Ring and Wrist-Worn Sleep Trackers?
Form factor significantly affects sleep tracker accuracy, comfort, and user compliance. Understanding the advantages and disadvantages of different wearing locations helps choose appropriate devices for individual needs and preferences.
Measurement location physiology creates fundamental differences between fingers and wrists. Finger arteries show higher perfusion with stronger photoplethysmography signals due to smaller tissue volume between sensors and blood vessels. This anatomical advantage allows ring-based trackers to achieve more stable heart rate measurements, particularly during sleep when minimal movement reduces artifacts.
A 2023 multicenter validation study comparing wearables, nearables, and smartphone apps found that ring devices achieved among the highest macro F1 scores for sleep stage classification (PMID: 37917155). The Oura Ring 3 demonstrated particularly strong performance with 0.68 macro F1 score, suggesting that ring placement provides advantages for sleep monitoring applications.
Wrist-worn devices benefit from larger form factors allowing bigger batteries and additional sensors. Smartwatches can incorporate screens for at-a-glance data viewing, GPS for activity tracking, and larger optical sensor arrays. However, these advantages matter less during sleep when screens remain dark and GPS unused. The increased weight and bulk of wrist-worn devices may affect sleep comfort compared to lightweight rings.
Motion artifacts affect wrist and finger measurements differently. During sleep, wrists may flex and extend with position changes, potentially disrupting sensor contact and introducing artifacts into photoplethysmography signals. Fingers typically remain more stationary during sleep, maintaining consistent sensor contact. A 2017 validation study found that wrist-worn devices showed increased heart rate measurement error during activities involving arm movement (PMID: 28538708), though this matters less during sleep than during exercise.
Comfort preferences vary considerably between individuals. Some users find rings more comfortable for sleeping, reporting no awareness of wearing the device. Others find rings uncomfortable, particularly if sized incorrectly or worn on fingers prone to swelling. Wrist-worn devices create similar individual variation, with some users sleeping comfortably wearing watches while others find them disruptive.
Temperature effects differ between locations. Fingers experience greater temperature variation than wrists due to peripheral vasoconstriction and vasodilation. This creates both advantages and disadvantages for ring sensors. Greater temperature variation may provide clearer signals for detecting temperature-based patterns like illness onset or menstrual cycle changes. However, extreme environmental temperatures may affect measurement accuracy more at finger locations.
Battery life typically favors rings despite smaller batteries. Rings lack power-hungry screens, GPS modules, and extensive processing capabilities required for daytime smartwatch functions. This allows optimizing designs specifically for sleep and recovery tracking rather than balancing multiple use cases. Most rings achieve 5-7 days of battery life, exceeding most smartwatches requiring daily charging.
The dual-purpose consideration matters for wrist-worn devices. Smartwatches combining sleep tracking with daytime fitness monitoring, notifications, and other smart features provide value beyond sleep-specific capabilities. Someone wanting comprehensive 24-hour tracking may prefer unified data from a single wrist-worn device rather than switching between rings for sleep and watches for activity. However, the compromise involves potentially reduced sleep tracking accuracy compared to purpose-built rings.
Skin irritation and allergies affect both form factors but manifest differently. Ring dermatitis can occur from moisture trapped under rings, material sensitivities, or compression of finger tissues. Wrist-worn devices may cause irritation from bands, pressure points, or sensors. Both issues typically resolve by changing wearing location, using different materials, or periodic device removal.
Data accuracy comparisons show nuanced differences. The 2023 validation study found that device type affected different metrics variably (PMID: 37917155). Wearables showed high proportional bias in sleep efficiency, while nearables exhibited high proportional bias in sleep latency. Rings balanced across metrics better than wrist devices optimizing certain measurements at the expense of others.
Cost considerations include broader ranges for wrist-worn devices. Basic fitness trackers start under $50, mid-range devices cost $100-300, and premium smartwatches exceed $400-1000. Rings typically occupy the premium segment from $119-400, with fewer budget options available. Subscription requirements add ongoing costs independent of form factor.
Social and professional contexts may influence preferences. Some individuals prefer wearing rings matching other jewelry without obvious technology appearance. Others find smartwatches acceptable accessories for all contexts. Certain professional environments may restrict wrist-worn devices while allowing rings, or vice versa. Individual preference and lifestyle context guide these considerations.
The practical decision process involves identifying priorities. Users wanting dedicated sleep tracking with maximum accuracy might prefer rings. Users wanting unified 24-hour tracking with one device might choose wrist-worn options. Users prioritizing budget might select wrist-worn fitness trackers over premium rings. Users particularly sensitive to wearing devices during sleep might prefer nearable devices placed on mattresses rather than worn directly.
Research validation exists for both form factors, suggesting either can provide useful data when properly designed and worn correctly. A 2024 meta-analysis examining wearables for detecting medical conditions included studies using both wrist-worn and ring devices with comparable performance (PMID: 39213525). This suggests that while theoretical advantages exist for finger placement, practical implementation and algorithms matter as much as measurement location.
How Long Should You Track Sleep Before Drawing Conclusions?
The minimum duration for meaningful sleep tracking depends on objectives, natural sleep variability, and the specific patterns being investigated. Understanding appropriate time frames helps avoid premature conclusions while allowing timely interventions when needed.
Individual night-to-night variability creates the need for multi-day tracking. Research shows that sleep duration, efficiency, and architecture vary considerably across nights even in healthy individuals maintaining consistent schedules. Stress, activity level, caffeine timing, alcohol consumption, meal timing, and subtle environmental changes all influence sleep patterns.
A 2025 World Sleep Society review emphasized that consumer health trackers excel at identifying patterns over time rather than providing precise single-night measurements (PMID: 40300398). The expert panel recommended focusing on trends across weeks rather than daily values, acknowledging accuracy limitations while recognizing value for longitudinal tracking.
For establishing personal baselines, 1-2 weeks of tracking provides initial reference values. This duration captures most normal variation while identifying typical sleep duration, timing, efficiency, and stage distribution. Baseline periods should occur during relatively normal circumstances, avoiding atypical weeks with illness, major schedule changes, or unusual stress.
Evaluating sleep quality changes after lifestyle modifications requires 2-4 weeks of tracking. Changes to sleep schedule, bedroom environment, supplements, exercise timing, or other interventions need sufficient time to produce measurable effects. The first few nights may show placebo effects, novelty effects, or adjustment periods before stable patterns emerge. Comparing 1-2 weeks before and after interventions provides more reliable assessment than comparing single nights.
Assessing seasonal variations requires months of tracking. Some individuals experience sleep changes across seasons related to daylight duration, temperature, humidity, and activity patterns. Comparing winter and summer sleep patterns requires tracking through both seasons. Research shows that circadian rhythms shift slightly with seasonal changes in daylight exposure, potentially affecting sleep timing and architecture.
Weekly cycles affect sleep patterns for many people. Weekend schedule changes, workday stress variations, and social activities create regular weekly patterns. Identifying these cycles requires at least 3-4 weeks of tracking to distinguish weekly patterns from random variation. Some devices provide weekly averages and identify weekend versus weekday differences to clarify these patterns.
Menstrual cycle effects in female users require tracking across multiple cycles. Sleep architecture shows subtle changes across menstrual phases, with some studies documenting increased sleep disruption during luteal phases. Identifying personal patterns requires tracking across 2-3 complete cycles to distinguish hormonal effects from other variables. Devices with temperature tracking can identify cycle phases more precisely, correlating sleep changes with specific hormonal windows.
Athletic training cycles affect sleep needs and architecture over weeks to months. Heavy training blocks typically increase sleep need and deep sleep duration. Taper periods may show reduced sleep need. Tracking across complete training cycles (typically 4-12 weeks) helps identify individual responses to training load and optimal recovery patterns. This information guides future training planning and periodization.
Chronic condition monitoring may require ongoing indefinite tracking. Conditions like chronic insomnia, sleep apnea, circadian rhythm disorders, or health issues affecting sleep benefit from continuous monitoring to track treatment responses and identify exacerbations. Long-term trends over months or years provide perspective on disease trajectories and treatment efficacy.
The statistical consideration involves distinguishing signal from noise. Single-night outliers rarely indicate meaningful changes, while consistent shifts over multiple nights warrant attention. Most devices provide trend lines, moving averages, or week-over-week comparisons to help identify signals emerging from natural variation.
A 2019 meta-analysis examining wearable activity tracker interventions found significant effects on physical activity participation (PMID: 30977740), but also noted that effects often attenuated over time. This suggests that initial tracking enthusiasm may inflate early behavior changes, with more stable patterns emerging after several weeks of sustained tracking.
The practical tracking approach involves three phases: establishment, intervention, and maintenance. Establishment phase (1-2 weeks) creates baseline understanding without attempting changes. Intervention phase (2-4 weeks) implements specific modifications while tracking responses. Maintenance phase continues periodic tracking to ensure changes persist and identify new patterns requiring adjustment.
Different metrics require different durations for reliable assessment. Total sleep time shows high night-to-night variation, requiring 7-14 nights to establish reliable averages. Sleep efficiency tends to be more stable, potentially showing meaningful patterns across 5-7 nights. Sleep stage percentages show considerable variation even with perfect measurement, requiring 10-14 nights for reliable characterization. Heart rate variability may show meaningful trends within 3-5 days if changes are large, but subtle shifts require 7-14 days to emerge from noise.
Acute changes to track immediately include sudden sleep latency increases, dramatic total sleep time reductions, or unusual oxygen desaturation patterns. These may indicate illness onset, medication effects, or acute stressors warranting immediate attention rather than waiting for multi-week trends. Clinical judgment about what constitutes concerning acute changes guides whether immediate action is appropriate.
The limitation involves potential for tracking burnout. Some users maintain interest for weeks but gradually stop engaging with data. Research in cancer survivors using wearable monitors found that adherence rates remained high during active interventions but tended to decline during maintenance phases (PMID: 36981693). This suggests that sustained tracking may require periodic goal reassessment and renewed motivation.
Data presentation timeframes should match objectives. Daily view helps identify acute changes and understand previous night’s influences. Weekly view smooths daily variation showing clearer patterns. Monthly view identifies longer trends and seasonal variations. Yearly view provides perspective on overall sleep health trajectory. Most apps provide multiple timeframes allowing appropriate scope selection.
What Features Matter Most in a Sleep Tracker?
Selecting a sleep tracker involves evaluating features against individual needs, budget, and goals. Understanding which capabilities provide practical value versus marketing appeal helps optimize choices.
Sleep stage classification represents the foundational feature distinguishing sleep trackers from simple activity monitors. Devices measuring heart rate, heart rate variability, and movement can estimate time spent in light, deep, and REM sleep. A 2023 multicenter validation study found that the best consumer sleep trackers achieved macro F1 scores of 0.68-0.69 for sleep stage classification compared to polysomnography (PMID: 37917155), suggesting that premium devices provide reasonably accurate stage estimates though not matching medical-grade precision.
The practical value of stage classification depends on user sophistication and goals. Someone simply confirming they’re sleeping 7+ hours may find stage breakdowns unnecessary. Someone optimizing recovery, investigating fatigue, or tracking training adaptations gains actionable insights from stage distribution trends. Athletes particularly value deep sleep tracking as an indicator of physical recovery.
Heart rate monitoring during sleep serves multiple purposes. Resting heart rate trends over weeks and months provide long-term cardiovascular health indicators, with sustained decreases often reflecting improved fitness and sustained increases potentially indicating overtraining, illness, or stress. A 2024 umbrella review found that wearables demonstrated mean bias of ±3% for heart rate measurement (PMID: 39080098), suggesting adequate accuracy for identifying meaningful trends.
Heart rate variability tracking provides recovery assessment capabilities particularly valuable for athletes and individuals managing chronic stress. HRV increases during restorative sleep as parasympathetic nervous system activity dominates. Tracking overnight HRV establishes personal baselines and identifies declining trends suggesting accumulated fatigue or inadequate recovery. Research supports using HRV to guide training intensity decisions, with low HRV indicating reduced capacity for intense exertion.
Battery life directly affects compliance and data completeness. Devices requiring daily charging create opportunities for users to forget recharging, producing data gaps. Devices lasting 5-7 days allow weekly charging routines reducing compliance barriers. Extended battery life matters more for sleep tracking than activity tracking since forgetting to wear a device overnight loses entire nights of data versus partial days.
Comfort and wearability determine whether users actually wear devices consistently. The most accurate tracker provides no value sitting in a drawer because it’s uncomfortable for sleeping. Form factor preferences vary individually, with some users finding rings imperceptible while others prefer wrist-worn devices or nearables placed on mattresses. Trial periods or return policies help assess comfort before committing to expensive devices.
Automatic sleep detection eliminates the need to manually indicate bedtime and wake time. Good algorithms recognize sleep onset and offset without user intervention, ensuring data capture even if users forget to activate sleep mode. Less sophisticated devices may require manual sleep mode activation, creating data gaps when users forget.
Smart alarm features use sleep stage data to wake users during light sleep within specified windows, theoretically reducing sleep inertia compared to awakening from deep sleep. Research on smart alarm efficacy shows mixed results, with some studies finding modest benefits while others show minimal differences compared to fixed-time alarms. Individual response variation suggests trying this feature if available but not prioritizing it as essential.
Temperature monitoring provides unique insights not available from heart rate or movement data. Skin temperature tracking can detect illness onset before symptoms appear, with research showing temperature increases 1-2 days before COVID-19 symptom development (PMID: 39213525). Female users benefit from cycle tracking through temperature variations correlated with ovulation and luteal phase changes. Environmental temperature effects on sleep can be identified through temperature data correlated with sleep quality metrics.
Blood oxygen saturation monitoring helps screen for sleep-disordered breathing. Devices measuring SpO2 can identify desaturation patterns potentially indicating sleep apnea warranting medical evaluation. However, a 2024 systematic review noted that consumer wearables showed mean absolute differences up to 2.0% for SpO2 measurement (PMID: 39080098), providing screening utility rather than diagnostic precision.
Respiratory rate tracking complements other metrics for illness detection and breathing pattern assessment. Normal sleeping respiratory rates range from 12-20 breaths per minute, with sustained elevations potentially indicating respiratory infection, anxiety, or other issues. Some research suggests respiratory rate changes may precede other illness indicators.
Data presentation quality affects usability and insight generation. Intuitive interfaces with clear visualizations help users identify patterns and understand data. Detailed trend analysis, customizable views, and export capabilities provide value for sophisticated users wanting deep data exploration. Simple daily scores help casual users quickly assess sleep quality without complexity.
Third-party integrations matter for users incorporating sleep data into broader health tracking. Connections to Apple Health, Google Fit, Strava, or other platforms centralize data and enable cross-platform analysis. API access allows developers to build custom integrations for specific use cases.
Subscription requirements significantly affect total ownership costs. Devices requiring ongoing subscriptions to access full features add $72-360 annually to ownership costs. Over typical 2-3 year device lifespans, subscriptions can exceed initial hardware costs. Users should evaluate whether subscription features justify ongoing expenses or whether subscription-free alternatives meet their needs.
Cloud storage and cross-device syncing provide convenience for users accessing data across phones, tablets, and computers. However, cloud storage raises privacy considerations about where health data resides and who controls access. Local-only storage provides more privacy but less convenience.
Coaching and recommendations add value if based on solid evidence and personalized appropriately. Generic sleep hygiene tips provide limited value beyond initial education. Sophisticated algorithms identifying individual patterns and providing specific actionable guidance offer more utility. However, many coaching features rely more on marketing than science.
Water resistance matters for users wanting continuous wear including showers and swimming. Sleep-only tracking doesn’t require water resistance if users remove devices during bathing. Users wanting 24-hour wear including water exposure should verify appropriate ratings (typically 5 ATM or 50 meters for swimming).
Accuracy specifications should be interpreted critically. Marketing claims about “clinical-grade accuracy” or specific percentage accuracies often lack independent validation. Peer-reviewed studies comparing devices to polysomnography provide stronger evidence than manufacturer claims. Devices featured in validation research (Oura, Fitbit, Apple Watch, WHOOP) generally show documented performance, while devices without independent validation introduce uncertainty.
How Do Environmental Factors Affect Sleep Tracker Readings?
Environmental conditions and user behaviors influence sleep tracker measurements, sometimes producing artifacts that mimic or mask genuine sleep patterns. Understanding these effects helps interpret data accurately and optimize measurement conditions.
Ambient temperature significantly affects both actual sleep quality and tracker measurements. Core body temperature naturally decreases 1-2°F during sleep, facilitating sleep onset and maintenance. Research shows that bedroom temperatures outside the optimal range of 60-67°F (15-19°C) disrupt sleep architecture, reducing deep sleep and REM sleep while increasing awakenings. Sleep trackers measuring skin temperature may show elevated readings in hot environments even if core temperature regulation remains intact.
Device temperature can affect sensor performance. Photoplethysmography sensors may show reduced accuracy when extremely cold or hot. Battery performance decreases in cold conditions, potentially reducing battery life or causing unexpected shutdowns. Most consumer devices specify operating temperature ranges, typically 32-95°F (0-35°C), with reduced accuracy or functionality outside these ranges.
Humidity affects comfort and potentially sleep quality through effects on thermoregulation. High humidity impairs evaporative cooling, making it harder to maintain optimal body temperature during sleep. Low humidity can dry airways, potentially increasing sleep disruption. However, humidity shows minimal direct effects on sleep tracker sensors unless condensation forms on devices, potentially disrupting optical sensors.
Altitude creates physiological changes affecting sleep and tracker measurements. At elevations above 8,000 feet (2,400 meters), reduced oxygen partial pressure triggers increased breathing rate and lighter sleep with more frequent arousals. Blood oxygen saturation naturally decreases with altitude, with values dropping to 90-95% at moderate elevations that would indicate hypoxemia at sea level. Users sleeping at altitude should interpret SpO2 readings relative to altitude-expected values rather than sea-level normal ranges.
Alcohol consumption affects both sleep architecture and tracker measurements. Alcohol initially increases deep sleep during the first half of the night while suppressing REM sleep, then disrupts sleep during the second half with increased awakenings and reduced sleep quality. Heart rate typically increases after alcohol consumption, while heart rate variability decreases. These effects persist for several hours, with the timing of alcohol consumption relative to sleep onset determining the magnitude of impact.
A 2024 umbrella review noted substantial heterogeneity in wearable device validation research (PMID: 39080098), making it difficult to assess how consistently environmental factors affect measurements across devices. However, alcohol’s effects on sleep are well-established through polysomnography research independent of tracking device limitations.
Caffeine timing and dosing affect sleep latency, total sleep time, sleep efficiency, and sleep architecture. Caffeine has a half-life of 3-7 hours depending on individual metabolism, with effects persisting 8-14 hours after consumption. Even caffeine consumed 6 hours before bedtime can reduce total sleep time and deep sleep percentage. However, habitual caffeine users may develop partial tolerance, showing less dramatic effects than naive users.
Medication effects on sleep vary widely by drug class. Stimulants typically increase sleep latency and reduce total sleep time. Sedatives may decrease sleep latency but often reduce deep sleep quality. Beta-blockers can suppress melatonin production, affecting sleep timing. Users should consider medication effects when interpreting sleep data, noting that tracker measurements likely reflect genuine medication effects on sleep rather than measurement artifacts.
Exercise timing affects sleep latency and architecture. Vigorous exercise within 2-3 hours of bedtime may delay sleep onset through elevated core temperature, sympathetic activation, and cortisol elevation. However, regular daytime exercise typically improves sleep quality, increasing deep sleep percentage and sleep efficiency. Sleep trackers should capture these genuine effects, allowing users to identify optimal exercise timing through experimentation.
Light exposure before bedtime suppresses melatonin production and shifts circadian timing, particularly blue-wavelength light from screens. Evening screen time typically increases sleep latency and may reduce total sleep time if bedtime remains fixed. Sleep trackers measuring sleep latency can objectively quantify screen time effects, providing feedback to support behavior changes.
Meal timing affects sleep through multiple mechanisms. Large meals consumed close to bedtime may cause discomfort, acid reflux, and sleep disruption. However, going to bed hungry may also disrupt sleep. Tracking sleep quality relative to meal timing helps identify individual optimal patterns.
Noise pollution affects sleep quality through increased arousals and reduced deep sleep, even when users don’t recall awakening. Sleep trackers may show reduced sleep efficiency and deep sleep percentage in noisy environments. However, individual noise sensitivity varies considerably, with some users sleeping well despite noise while others show marked sensitivity.
Partner effects create complex interactions. Bed partners’ movements may trigger false awakenings in devices with sensitive motion detection. Partners’ snoring, temperature effects on shared bedding, and sleep timing differences can all affect sleep quality and potentially tracker measurements. Some devices attempt to filter partner movements from user data, though success varies.
Device positioning affects measurement accuracy. Rings should fit snugly without excessive tightness, maintaining consistent sensor contact throughout the night. Wrist-worn devices should be positioned 1-2 finger widths above the wrist bone on the non-dominant hand for most accurate heart rate measurement. Loose devices may shift during sleep, creating measurement artifacts or data gaps.
Skin characteristics including tone, tattoos, and condition affect photoplethysmography accuracy. Darker skin tones may reduce signal quality due to increased light absorption, though modern devices using multiple wavelengths partly compensate. Dense tattoos over sensor areas can block light penetration, severely reducing accuracy. Dry, callused, or scarred skin may affect sensor contact and signal quality.
A 2017 validation study found that wrist-worn devices showed higher heart rate measurement error for participants with darker skin tones (PMID: 28538708), highlighting the importance of inclusive validation studies across diverse populations.
Illness affects multiple sleep metrics through various mechanisms. Fever increases resting heart rate and body temperature while disrupting sleep architecture. Respiratory infections increase breathing rate and may reduce SpO2. Pain and discomfort increase awakenings and reduce sleep quality. These genuine physiological changes should be captured by sleep trackers, potentially providing early illness detection before symptoms become apparent.
Stress and anxiety affect sleep through elevated cortisol, sympathetic nervous system activation, and racing thoughts. Sleep trackers typically show increased sleep latency, reduced sleep efficiency, decreased deep sleep, and reduced heart rate variability during stressful periods. These measurements reflect genuine stress effects rather than measurement artifacts.
The practical approach involves noting environmental factors and behaviors in context with sleep data. Many apps include note-taking features for recording alcohol, caffeine, exercise, stress, or other variables potentially affecting sleep. Tracking these alongside sleep metrics helps identify individual cause-effect relationships rather than wondering whether data variations reflect measurement artifacts or genuine changes.
Our Research and Recommendations
Related Reading
Understanding sleep monitoring exists within broader context of sleep optimization, recovery, and health tracking. These related resources provide additional evidence-based information on complementary topics.
Best Light Therapy Lamps examines research-validated light therapy devices for circadian rhythm regulation, seasonal affective disorder management, and sleep timing optimization. Light exposure timing significantly affects melatonin secretion and sleep onset, making light therapy a valuable complement to sleep tracking for individuals with circadian rhythm disorders or shift work challenges.
Best Weighted Blankets reviews evidence for deep pressure stimulation through weighted blankets for reducing anxiety and improving sleep quality. Research demonstrates that weighted blankets can decrease sleep latency and increase sleep duration in individuals with anxiety or sensory processing issues, providing a non-pharmaceutical sleep intervention to track alongside wearable data.
Best White Noise Machines analyzes sound masking devices for blocking disruptive environmental noise that fragments sleep architecture. Sleep trackers can objectively measure whether white noise improves sleep efficiency and reduces awakenings, allowing users to verify device effectiveness through data.
Circadian Rhythm Disorders provides comprehensive information about delayed sleep phase disorder, advanced sleep phase disorder, shift work disorder, and other circadian timing conditions. Sleep trackers excel at identifying circadian misalignment through consistent sleep timing patterns that may warrant clinical evaluation and treatment.
Best Sleep Supplement Stacks examines research evidence for magnesium, glycine, theanine, and other compounds supporting sleep quality. Sleep trackers provide objective measurement of whether supplement interventions improve sleep latency, duration, or architecture, moving beyond subjective impressions to data-driven assessment of effectiveness.
Frequently Asked Questions
How accurate are sleep trackers and smart rings compared to polysomnography?
Consumer sleep trackers show varying accuracy levels. Research from a 2023 validation study published in JMIR mHealth and uHealth found that the best devices achieved macro F1 scores of 0.69 when compared to polysomnography (the gold standard). Most wearables tend to overestimate total sleep time by 10% or more, but accurately measure heart rate with median errors below 5%. Smart rings like the Oura Ring demonstrated better accuracy for detecting sleep stages compared to wrist-worn devices in laboratory testing.
What is heart rate variability (HRV) and why does it matter for sleep tracking?
Heart rate variability measures the variation in time between consecutive heartbeats, reflecting your autonomic nervous system activity. During deep sleep, HRV typically increases as your parasympathetic nervous system becomes more active. Sleep trackers that monitor HRV can provide insights into sleep quality and recovery. Higher HRV during sleep generally indicates better recovery and lower stress levels, while consistently low HRV may suggest inadequate rest or overtraining.
Can sleep trackers help identify sleep disorders?
Sleep trackers can help identify patterns that warrant medical attention, but they cannot diagnose sleep disorders. A 2022 study in Studies in Health Technology and Informatics found that Fitbit devices could detect normal sleep patterns but were less able to detect abnormal ones in patients with obstructive sleep apnea. The World Sleep Society recommends using consumer health trackers as screening tools rather than diagnostic devices, and consulting a healthcare provider if patterns suggest sleep disorders.
How long do smart ring batteries typically last?
Battery life varies significantly between smart rings. The Oura Ring 4 provides 5-7 days of battery life on a single charge. WHOOP 5.0 lasts 4-5 days with its battery pack system. Budget options like the POBOVi Ring typically offer 5-6 days. Charge time ranges from 90 minutes to 2 hours for most devices. Battery performance may decrease with continuous heart rate monitoring and frequent data syncing.
Do I need a subscription to use sleep tracking features?
Subscription requirements vary by device. The Oura Ring 4 requires a $5.99 monthly membership after a 1-month trial for full access to sleep insights and trends. WHOOP 5.0 operates entirely on a subscription model ($239/year or $30/month) with no upfront device cost. The POBOVi Ring provides basic sleep tracking without a subscription, though advanced features may require payment. Consider long-term subscription costs when calculating total ownership expenses.
Bottom Line
Consumer sleep trackers and smart rings have matured into useful tools for monitoring sleep patterns, identifying trends, and supporting sleep optimization efforts when expectations align with documented capabilities. Research validation demonstrates that premium devices achieve reasonable accuracy for total sleep time, heart rate, and heart rate variability, with macro F1 scores reaching 0.68-0.69 for sleep stage classification compared to polysomnography. However, all consumer devices show limitations including tendency to overestimate sleep duration by 10%+ and difficulty distinguishing quiet wakefulness from light sleep.
The Oura Ring 4 Silver represents the best overall choice for most users seeking accurate sleep monitoring through research-validated sensors, superior form factor for overnight wear, comprehensive sleep stage classification, heart rate variability tracking for recovery assessment, and unique temperature monitoring for illness detection and cycle tracking. The $349 price point plus $5.99 monthly subscription creates significant investment, justified for users prioritizing accuracy and detailed insights over budget considerations.
Athletes and fitness enthusiasts benefit most from WHOOP 5.0’s comprehensive recovery monitoring, sophisticated strain tracking, and detailed physiological data supporting training optimization. The subscription-only model ($239 annually) includes hardware upgrades and continuous feature development, though the approach commits users to ongoing payments. Five-LED sensor arrays improve measurement accuracy during movement, while continuous battery charging prevents data gaps.
Budget-conscious users find excellent value in the POBOVi Ring OnePlus at $119 without mandatory subscriptions. While independent validation studies remain limited compared to premium alternatives, the device provides essential sleep tracking functionality including sleep stage classification, heart rate monitoring, and basic sleep quality insights sufficient for users wanting to verify sleep duration, identify timing patterns, and track lifestyle intervention effects without premium costs.
Successful sleep tracker use requires realistic expectations aligned with documented capabilities. These devices excel at identifying relative changes and patterns over time for individual users, quantifying sleep consistency, and providing objective data supporting behavior modifications. However, they cannot diagnose sleep disorders, provide medical-grade precision, or replace polysomnography when clinical sleep evaluation is warranted. The 2025 World Sleep Society recommendations appropriately position consumer health trackers as screening and monitoring tools rather than diagnostic devices.
The practical value calculation depends heavily on individual goals, budget, and commitment to using data for meaningful behavior changes. Research demonstrates that wearable activity tracker interventions significantly increase physical activity participation through self-monitoring and feedback, suggesting similar mechanisms likely support sleep behavior improvement. However, sustained engagement requires deliberate effort, periodic goal reassessment, and avoiding excessive tracking anxiety that paradoxically worsens sleep.
Form factor preferences vary individually, with ring-based trackers offering measurement advantages from superior finger blood perfusion while wrist-worn devices provide larger batteries, screens, and daytime functionality beyond sleep tracking. Comfort determines compliance more than technical specifications, making trial periods valuable for assessing whether devices integrate seamlessly into nightly routines or create friction reducing consistent wear.
Environmental factors, user behaviors, and individual physiology all influence both actual sleep quality and tracker measurements. Understanding these effects helps interpret data accurately rather than overreacting to natural variation or measurement artifacts. Tracking sleep requires minimum 1-2 weeks to establish baselines and 2-4 weeks to evaluate intervention effects, focusing on trend identification rather than daily fluctuations.
The integration of sleep tracking into broader health optimization efforts amplifies value through correlating sleep quality with exercise, nutrition, stress, light exposure, and other modifiable factors. Sleep trackers provide objective measurement infrastructure supporting experimentation with evidence-based interventions including sleep schedule consistency, bedroom environment optimization, light therapy for circadian regulation, and supplement protocols when appropriate.
For individuals experiencing persistent sleep difficulties, excessive daytime sleepiness, witnessed apneas, or other concerning patterns, sleep tracker data should prompt medical evaluation rather than self-diagnosis or treatment. Bringing longitudinal data to healthcare providers helps focus clinical assessment on patterns most likely indicating diagnosable conditions warranting treatment.
The sleep tracking market continues evolving with improving accuracy, expanding features, and better integration into clinical workflows. However, fundamental limitations of consumer devices measuring sleep indirectly through movement and heart rate rather than brain activity mean that precision will remain constrained compared to polysomnography. These tools serve best as continuous long-term monitoring systems complementing rather than replacing clinical sleep evaluation when indicated.
Choose the Oura Ring 4 for maximum accuracy and comprehensive insights with acceptable subscription costs, WHOOP 5.0 for athlete-focused recovery optimization despite higher ongoing expenses, or POBOVi Ring OnePlus for budget-friendly essential sleep tracking without mandatory subscriptions. All three provide meaningful data supporting sleep optimization when used with realistic expectations and commitment to acting on insights rather than passively accumulating numbers.
Recommended Products
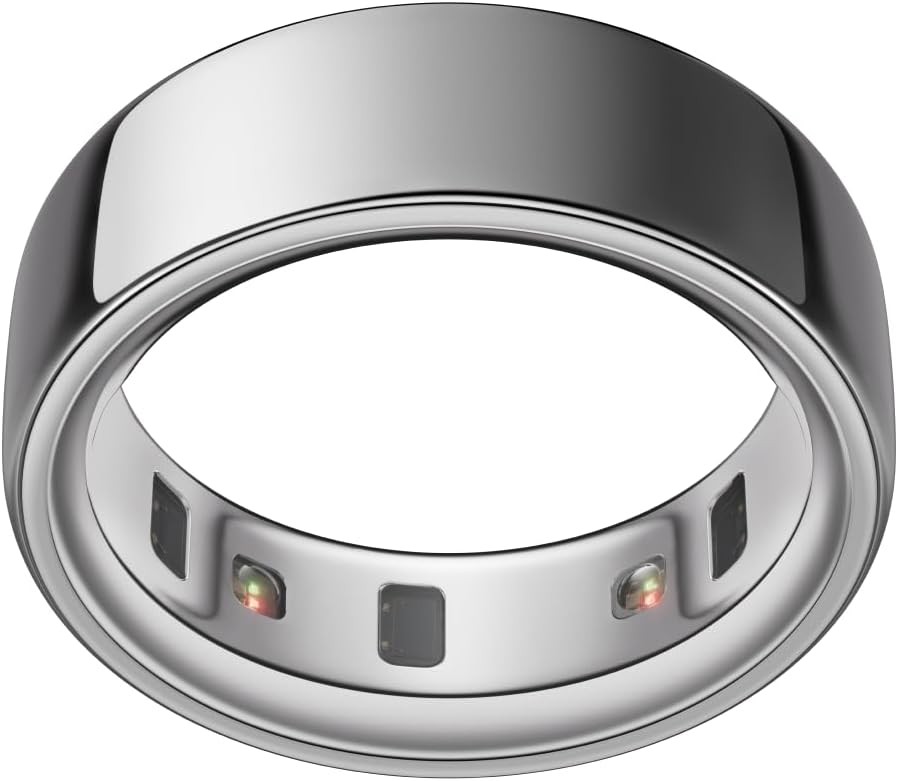
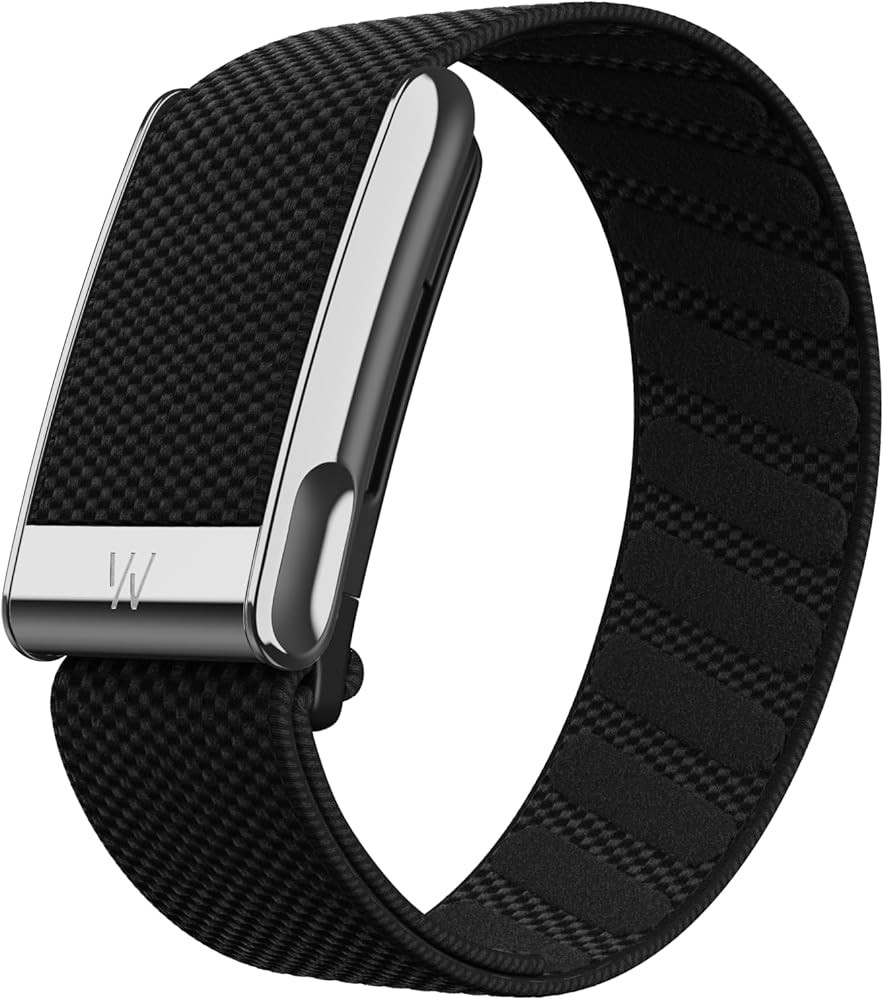
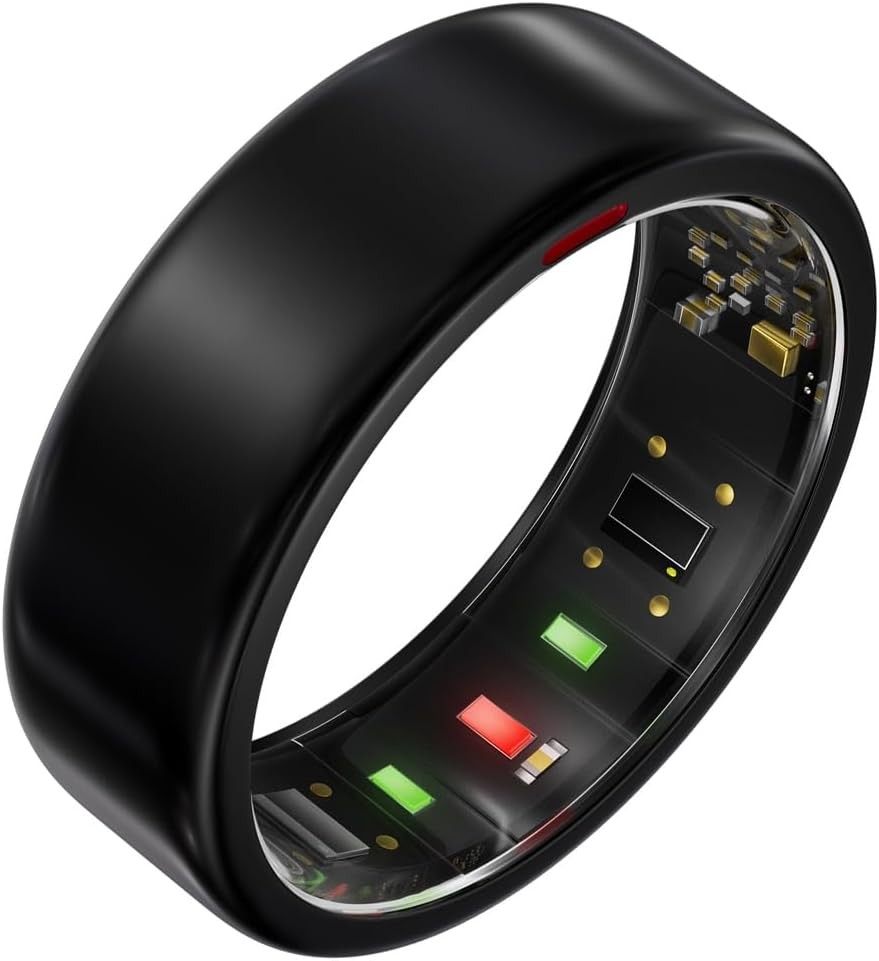
Get Weekly Research Updates
New studies, updated reviews, and evidence-based health insights delivered to your inbox. Unsubscribe anytime.