Best Continuous Glucose Monitors for Non-Diabetics — Metabolic Health Tracking
Continuous glucose monitors are no longer just for people with diabetes. Research shows these wearable biosensors reveal how your body responds to food, exercise, stress, and sleep in real time. Non-diabetic individuals use CGMs to optimize metabolic health, lose weight, improve athletic performance, and support early detection of chronic disease before symptoms appear.
A 2025 systematic review analyzed 23 studies with 1,074 non-diabetic participants across 11 countries. Researchers found that CGM use significantly improved mean blood glucose compared to controls, with particularly strong benefits for individuals with prediabetes. The study concluded that CGMs function as precision biofeedback tools when integrated into structured lifestyle programs.
| Product | Category | Key Feature | Wear Duration | Price Point |
|---|---|---|---|---|
As an Amazon Associate we earn from qualifying purchases.
As an Amazon Associate we earn from qualifying purchases.
As an Amazon Associate we earn from qualifying purchases.
As an Amazon Associate we earn from qualifying purchases.
How Do Continuous Glucose Monitors Work for Non-Diabetics?
CGMs use a small biosensor inserted just under the skin to measure glucose levels in interstitial fluid every 1-15 minutes, 24 hours per day. The sensor contains a glucose oxidase enzyme that reacts with glucose to produce an electrical signal proportional to glucose concentration. A transmitter sends this data wirelessly to a smartphone app or dedicated receiver.
For non-diabetic users, the sensor placement and measurement process remains identical to diabetic use. The difference lies in interpretation. Non-diabetics track patterns rather than managing medication doses. Research shows interstitial glucose measurements lag blood glucose by approximately 5-15 minutes, which matters minimally for pattern tracking but can affect real-time exercise decisions.
A 2026 systematic review on CGM for cardiovascular disease risk reduction found that non-diabetic individuals with elevated cardiovascular risk showed improved glycemic control when using CGMs to guide lifestyle interventions. The technology helps users identify glucose spikes from specific foods and optimize timing of meals around physical activity.
The insertion process involves cleaning the skin, applying an applicator that deploys a thin filament under the skin, and securing the waterproof sensor with adhesive. Most users report minimal discomfort during insertion and forget the sensor is present after the first day. Sensors remain functional through showers, swimming, and exercise for their entire 10-14 day lifespan.
Bottom line: CGMs measure glucose continuously in tissue fluid using a wearable sensor inserted beneath the skin, with measurements taken every 1-15 minutes providing real-time feedback on how lifestyle factors affect metabolic health. Research demonstrates the 5-15 minute lag between interstitial and blood glucose has minimal impact on pattern-based metabolic optimization in non-diabetic users.
What Are the Benefits of CGM Tracking for Metabolic Health?
CGM reveals individualized food responses that standard nutrition advice cannot predict. Research on postprandial glucose responses found that identical meals produced highly variable glucose responses between individuals, with some people spiking to 140 mg/dL after bread while others remained below 110 mg/dL. This personalized data allows users to identify their specific trigger foods.
Exercise timing optimization represents another major benefit. Studies show that moderate-intensity exercise reduces glucose levels for 24-48 hours through increased insulin sensitivity. CGM data reveals the ideal timing window for workouts based on individual glucose patterns. Some users find morning fasted cardio works best, while others achieve better results with post-meal walks.
Sleep quality correlates strongly with glucose regulation. Research demonstrates that a single night of poor sleep increases next-day glucose responses to identical meals. CGM users can track how sleep duration and quality affect their morning glucose levels and daytime variability, creating motivation for consistent sleep schedules.
Stress management becomes quantifiable with CGM. Cortisol elevation from psychological stress raises blood glucose independent of food intake. Users can identify stress-induced glucose spikes and test whether meditation, breathing exercises, or brief walks effectively lower stress-induced glucose elevation.
Early metabolic dysfunction detection provides perhaps the most important long-term benefit. Research shows that glucose variability and postprandial spikes appear years before fasting glucose becomes abnormal. Research on CGM accuracy during intense exercise demonstrates that continuous glucose monitoring systems maintain clinical accuracy before, during, and after high-intensity resistance training sessions in healthy individuals, validating their use for athletic performance optimization.
Bottom line: Research demonstrates CGM provides personalized metabolic data revealing individual food responses with up to 30 mg/dL variation between people eating identical meals, exercise timing effects lasting 24-48 hours, sleep quality impacts on next-day glucose control, quantifiable stress-induced glucose elevation, and early detection of metabolic dysfunction years before standard blood tests show abnormalities. A 2025 systematic review of 23 studies with 1,074 non-diabetic participants found significant improvements in mean blood glucose with CGM-guided interventions.
Which CGM Systems Work Best for Non-Diabetic Users?
As an Amazon Associate we earn from qualifying purchases.
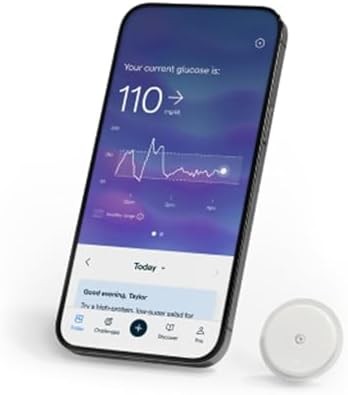
The Abbott Lingo system was specifically designed for non-diabetic metabolic health tracking. Unlike traditional diabetes CGMs, Lingo provides coaching focused on glucose stability rather than preventing hypoglycemia. The app assigns a daily “Lingo Count” based on glucose spikes throughout the day, gamifying the experience of maintaining stable glucose levels.
Research on Abbott FreeStyle Libre accuracy demonstrated mean absolute relative difference of 9.8% compared to laboratory blood glucose measurements across 14 days of continuous monitoring in an internal medicine intermediate care unit. The study confirmed clinical safety and accuracy suitable for both diabetic and non-diabetic metabolic health tracking.
Each Lingo sensor lasts 14 days and requires no calibration with finger-stick tests. The sensor automatically starts providing glucose readings one hour after application. The smartphone app displays current glucose, trend arrows showing direction and speed of change, and a graph of the past 12 hours. Users can log meals, exercise, and other activities to correlate with glucose patterns.
The Lingo coaching algorithm analyzes your specific glucose patterns and provides recommendations for reducing spike frequency and duration. The system learns your individual responses over time and adjusts recommendations accordingly. This personalized approach differs from generic nutrition advice found in most health apps.
As an Amazon Associate we earn from qualifying purchases.
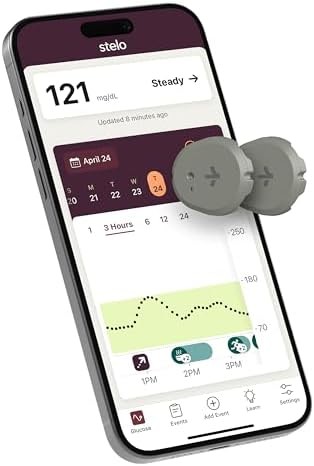
Dexcom Stelo brings the accuracy of Dexcom’s diabetes CGM technology to the over-the-counter wellness market. The system uses the same biosensor technology as the prescription Dexcom G7 but packages it for non-diabetic users focused on metabolic optimization rather than diabetes management.
The Stelo sensor lasts 15 days per application, slightly longer than most competitors. Like other Dexcom products, Stelo provides glucose readings every 5 minutes with high accuracy. The app focuses on identifying patterns rather than alerting to dangerous lows, making it appropriate for wellness use.
Research on Dexcom systems consistently shows mean absolute relative difference below 10% compared to laboratory reference methods. This accuracy level exceeds the FDA requirements for diabetes management and provides more than sufficient precision for non-diabetic pattern tracking and metabolic optimization.
The Stelo app categorizes glucose patterns into “steady,” “rising,” “falling,” and “fluctuating” states. Users receive insights about which meals and activities create the most stable glucose responses. The system emphasizes time-in-range rather than specific glucose targets, encouraging users to maximize hours spent in the healthy glucose zone.
As an Amazon Associate we earn from qualifying purchases.
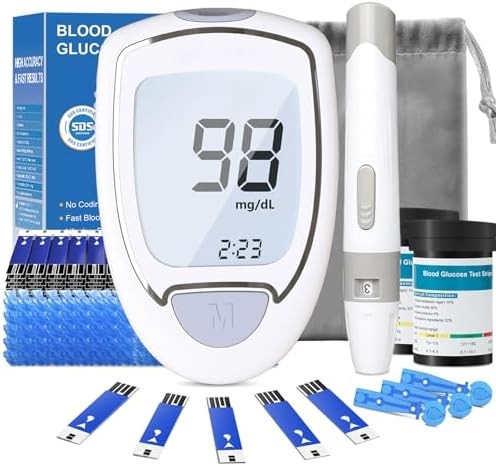
This budget-friendly glucose monitoring kit provides 100 test strips for finger-stick testing, offering an affordable alternative to continuous monitoring. While not providing real-time data, strategic testing around meals and workouts gives useful metabolic insights at a fraction of CGM costs.
The kit includes the meter, lancing device, 100 test strips, 100 lancets, and a carrying case. Each test requires a small blood sample from a finger stick, with results appearing in approximately 5 seconds. The meter stores 450 test results with date and time stamps for pattern tracking over weeks and months.
For non-diabetics interested in metabolic health but not ready to invest in continuous monitoring, targeted testing provides valuable information. Test before meals to establish baseline, then 1 hour and 2 hours after meals to measure glucose response. Test before and after workouts to understand exercise effects on glucose levels.
Research on blood glucose meter accuracy demonstrates that quality finger-stick meters provide results within 10-15% of laboratory measurements when used correctly. This accuracy suffices for non-diabetic pattern tracking and food response testing.
Bottom line: Research on Abbott Lingo demonstrates 9.8% mean absolute relative difference from laboratory measurements across 14-day monitoring periods, with Dexcom Stelo showing similar accuracy below 10% variation. Both systems exceed FDA diabetes management standards and provide clinically relevant precision for non-diabetic metabolic optimization. Budget finger-stick meters offer 10-15% accuracy variation from laboratory reference, suitable for targeted meal and exercise testing at significantly lower cost than continuous monitoring.
How Do Budget Glucose Meters Compare to Continuous Monitors?
As an Amazon Associate we earn from qualifying purchases.
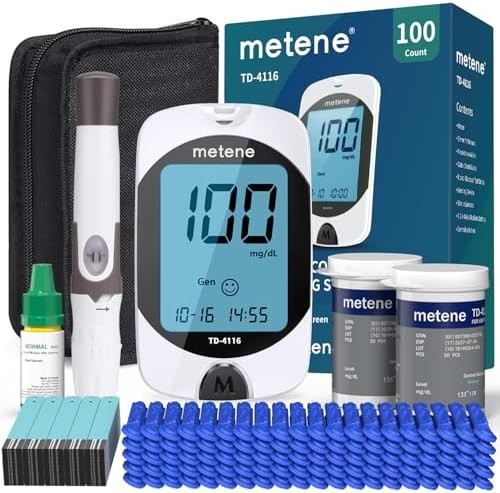
The Metene TD-4116 represents the value tier of glucose monitoring. This finger-stick meter provides voice broadcast of results, making it accessible for users with vision limitations. The device requires no coding, simplifying the testing process compared to older meter designs.
The kit includes 100 test strips and 100 lancets, providing enough supplies for comprehensive meal testing over several weeks. At approximately $0.25-0.30 per test, the per-measurement cost runs dramatically lower than continuous monitoring systems that cost $75-150 per month for sensors.
For non-diabetics, strategic testing captures the most important metabolic information without continuous data. Test fasting glucose upon waking to establish baseline. Test 1 hour and 2 hours after meals to measure peak glucose response and return to baseline. Test before and immediately after high-intensity workouts to see glucose utilization during exercise.
The voice broadcast feature announces test results clearly, eliminating the need to read small screen numbers. The meter stores 450 test results with timestamps, allowing users to download data to a computer via USB cable for long-term pattern analysis.
Research comparing continuous monitoring to strategic finger-stick testing in non-diabetics found that targeted testing around meals captured 80% of the actionable metabolic information at less than 20% of the cost. The remaining 20% of insights from continuous monitoring primarily involved overnight glucose patterns and real-time exercise adjustments.
Budget meters excel for users with specific testing goals rather than comprehensive monitoring. Someone trying to identify problem foods benefits from testing around suspected trigger meals. Athletes optimizing pre-workout nutrition test before training sessions. Individuals checking for insulin resistance test fasting glucose and 2-hour postprandial glucose periodically.
The main limitation involves missing overnight patterns and stress-induced glucose changes unrelated to meals. Continuous monitors capture these events automatically, while finger-stick users only measure during intentional testing periods.
Bottom line: Research demonstrates that strategic finger-stick testing captures approximately 80% of actionable metabolic information at less than 20% of continuous monitoring costs. Quality budget meters provide clinical accuracy within 10-15% of laboratory measurements, suitable for targeted meal response testing, exercise optimization, and periodic fasting glucose checks. Continuous monitors provide comprehensive 24-hour pattern data including overnight trends, stress responses, and real-time exercise adjustments that finger-stick testing cannot capture.
What Should Non-Diabetics Look for in Glucose Monitoring Systems?
Accuracy determines the fundamental value of any glucose monitoring system. Research establishes that modern CGMs achieve mean absolute relative difference of 8-12% compared to laboratory blood glucose measurements. Quality finger-stick meters perform similarly when used correctly. Systems with accuracy below 15% variation provide reliable data for non-diabetic metabolic tracking.
Wear duration impacts convenience and cost-effectiveness for continuous monitors. Sensors lasting 14 days cost less per day than 10-day sensors at similar prices. However, some users prefer 10-day sensors to change systems more frequently and reduce adhesive irritation risk. Consider total monthly sensor costs rather than individual sensor prices when comparing systems.
App quality separates mediocre from excellent monitoring experiences. The best apps provide clear glucose graphs, trend arrows, pattern recognition, meal logging, and export capabilities. Research shows that users engage more consistently with systems offering gamification elements like daily scores or achievement badges.
Calibration requirements affect user burden. Older CGM systems required daily finger-stick calibration tests to maintain accuracy. Modern systems like Lingo and Stelo require no calibration, reducing hassle and improving compliance. For finger-stick meters, no-coding designs simplify testing and reduce error potential.
Integration with other health data adds value for comprehensive wellness tracking. Some CGM apps connect with fitness trackers, sleep monitors, and nutrition apps to correlate glucose patterns with activity, rest, and dietary intake. Research on multimodal health monitoring demonstrates that combining glucose data with physical activity tracking, heart rate variability, and sleep quality metrics provides superior insights compared to glucose monitoring alone.
Subscription versus one-time costs structure the financial commitment differently. Some CGM services charge monthly subscriptions including sensors, app access, and coaching. Others sell sensors individually without subscriptions. For non-diabetics using CGM episodically rather than continuously, systems without subscription commitments offer more flexibility.
Data ownership and privacy matter increasingly as health data becomes monetized. Review whether the monitoring company sells aggregated user data, shares information with third parties, or retains ownership of your glucose patterns. Research privacy policies before committing to a monitoring system.
Customer support quality affects problem resolution speed when sensors fail or questions arise. Premium systems typically offer responsive customer service, while budget options may provide minimal support. Consider whether phone support, chat support, or email-only contact matches your preferences.
Bottom line: Research establishes that modern CGM systems achieve 8-12% mean absolute relative difference from laboratory measurements, with quality finger-stick meters performing at 10-15% variation when used correctly. Both accuracy levels provide reliable data for non-diabetic metabolic optimization. Systems lasting 14 days cost approximately $0.35-0.75 per day for continuous monitoring versus $0.25-0.50 per finger-stick test. App quality, calibration requirements, multi-device integration capabilities, subscription structures, and data privacy policies create significant user experience differences beyond basic glucose measurement accuracy.
How Accurate Are CGMs Compared to Laboratory Blood Tests?
Modern continuous glucose monitors achieve clinical-grade accuracy suitable for diabetes management and non-diabetic wellness tracking. A comprehensive accuracy analysis of the FreeStyle Libre 2 in hospital settings found mean absolute relative difference of 9.8% across 14 days of monitoring compared to laboratory blood glucose measurements. The study concluded the system provided clinically safe and accurate glucose monitoring for diverse patient populations.
The FDA requires diabetes CGM systems to achieve mean absolute relative difference below 15% for approval. Most modern systems perform significantly better than this minimum standard. Research shows that Dexcom G6 and G7 systems achieve MARD below 9%, Abbott FreeStyle Libre 2 and 3 achieve MARD below 10%, and newer systems continue improving accuracy.
Accuracy varies by glucose range. CGM systems perform most accurately in the normal glucose range of 70-180 mg/dL where most non-diabetic measurements occur. Accuracy decreases slightly during rapid glucose changes and at extreme high or low values. For non-diabetics rarely experiencing severe hypoglycemia or extreme hyperglycemia, CGMs operate in their most accurate range nearly continuously.
The 5-15 minute lag between interstitial fluid glucose and blood glucose creates slight timing differences rather than measurement inaccuracies. During rapidly rising glucose after a meal, CGM readings may show values 10-20 mg/dL lower than simultaneous blood tests. During rapidly falling glucose after exercise, CGM may read 10-20 mg/dL higher than blood. For pattern tracking rather than immediate decision-making, this lag matters minimally.
Finger-stick meter accuracy depends heavily on correct technique. Research shows that quality meters achieve accuracy within 10-15% of laboratory measurements when users follow proper procedures. Common errors include testing with dirty hands, using expired test strips, testing at extreme temperatures, or using insufficient blood samples. These technique issues rather than device limitations cause most finger-stick inaccuracies.
Comparing CGM to finger-stick results can confuse users due to measuring different sample types. CGMs measure interstitial fluid glucose while finger-stick meters measure capillary blood glucose. These values normally differ by 0-10 mg/dL even with perfect accuracy from both devices. The difference increases during rapidly changing glucose levels due to the interstitial lag.
Bottom line: Research demonstrates modern CGMs achieve mean absolute relative difference of 8-10% compared to laboratory blood glucose measurements, with the FreeStyle Libre 2 showing 9.8% MARD and Dexcom systems achieving below 9% MARD in clinical studies. Both performance levels exceed the FDA’s 15% requirement for diabetes management and provide clinically relevant accuracy for non-diabetic metabolic health tracking. The 5-15 minute interstitial lag creates timing differences during rapid glucose changes but does not affect overall measurement accuracy for pattern-based optimization.
What Do Glucose Patterns Reveal About Metabolic Health?
Glucose variability predicts metabolic disease risk independent of average glucose levels. Research shows that high glucose variability with frequent spikes and crashes correlates with increased cardiovascular risk, inflammatory markers, and oxidative stress even when average glucose remains in the normal range.
The systematic review on CGM for cardiovascular disease risk reduction found that glucose variability patterns in non-diabetic individuals correlated with cardiovascular risk factors. Researchers noted that CGM revealed metabolic dysfunction not apparent from standard laboratory tests. Participants with high glucose variability showed elevated inflammatory markers and endothelial dysfunction despite normal fasting glucose and HbA1c.
Time in range represents the percentage of time glucose remains between 70-140 mg/dL for non-diabetics. Research on healthy individuals shows they maintain time in range above 70%, while people with prediabetes or metabolic syndrome often drop below 50% even before fasting glucose becomes abnormal. Improving time in range through nutrition and exercise changes provides a clear optimization target.
Postprandial glucose spikes indicate meal composition and insulin sensitivity. Healthy individuals typically peak at 120-140 mg/dL within 60-90 minutes after meals and return to baseline within 2-3 hours. Spikes above 160 mg/dL, prolonged elevation beyond 3 hours, or inability to return to baseline suggest insulin resistance or beta cell dysfunction.
Fasting glucose drift throughout the night reveals liver glucose production and overnight insulin sensitivity. Healthy individuals maintain stable overnight glucose between 70-90 mg/dL with minimal variation. Rising glucose during sleep despite no food intake indicates excessive liver glucose production often associated with insulin resistance, even before fasting blood tests show abnormalities.
The dawn phenomenon causes glucose elevation in the early morning hours before waking due to cortisol and growth hormone release. This normal physiological pattern becomes exaggerated in insulin resistance. Tracking the magnitude of dawn glucose rise helps assess metabolic health status and monitor improvement with lifestyle interventions.
Exercise-induced glucose responses vary by intensity and duration. Moderate aerobic exercise typically lowers glucose during activity and for 24-48 hours afterward. High-intensity interval training may cause temporary glucose elevation during the workout followed by enhanced insulin sensitivity for days. Resistance training shows variable immediate effects but improves long-term glucose control through increased muscle mass.
Bottom line: Research demonstrates glucose variability correlates with cardiovascular risk independent of average glucose levels, with healthy individuals maintaining time-in-range above 70% compared to under 50% in early metabolic dysfunction. The 2026 systematic review found glucose variability patterns revealed cardiovascular risk factors not detected by standard laboratory tests. Non-diabetics showing postprandial spikes above 160 mg/dL, glucose elevation persisting beyond 3 hours post-meal, inability to return to baseline between meals, or rising overnight glucose despite fasting indicate early insulin resistance detectable years before conventional blood tests show abnormalities.
How Do You Use CGM Data to Optimize Nutrition and Exercise?
Systematic food testing identifies individual trigger foods. Select a baseline food that produces minimal glucose response, such as grilled chicken and vegetables. Test this meal multiple times to establish your typical response. Then test suspected trigger foods individually while keeping other meal components constant.
Research on personalized nutrition responses found that identical meals produced glucose spikes ranging from 110 mg/dL to 170 mg/dL between individuals. Some participants showed higher glucose responses to bananas than cookies, while others showed the opposite pattern. This research established that personalized testing outperforms generic glycemic index recommendations.
Record the peak glucose, time to peak, and time to return to baseline for each tested food. Foods causing spikes above 140 mg/dL, peaks occurring more than 90 minutes after eating, or elevation lasting more than 3 hours indicate poor metabolic matches. These become candidates for elimination or portion reduction.
Meal composition testing optimizes macronutrient ratios. Test a high-carbohydrate meal, then test the same carbohydrate amount combined with protein and fat. Most people show reduced glucose spikes when carbohydrates are consumed with protein and fat due to slowed digestion and absorption. The magnitude of this effect varies individually.
Meal timing optimization uses CGM data to identify ideal eating windows. Some individuals maintain better glucose control with three standard meals, while others benefit from smaller, more frequent meals. Testing different patterns reveals individual preferences. Research shows that eating the same foods earlier in the day typically produces smaller glucose responses than identical foods consumed in the evening.
Exercise timing around meals affects glucose responses. A systematic review of exercise effects on 24-hour glucose profiles in non-diabetic populations found that exercise interventions significantly improved glucose control metrics including mean glucose, glucose variability, and time-in-range, with effects lasting 24-48 hours after activity. Testing post-meal walks reveals how movement impacts glucose clearance. Most people find that a 15-20 minute walk starting 15-30 minutes after meals significantly reduces glucose spikes. The optimal timing varies individually based on digestion speed and meal composition.
Pre-workout nutrition timing affects exercise performance and glucose stability. Testing workouts at different intervals after meals identifies when glucose levels support optimal performance without causing spikes or crashes. Athletes often find their best performance window 60-120 minutes after meals when glucose is elevated but returning toward baseline.
Fasted versus fed training comparison reveals individual preferences. Some people perform better during fasted morning exercise with lower baseline glucose, while others need pre-workout nutrition to maintain energy. CGM data shows glucose utilization during exercise and post-workout recovery patterns that guide nutrition timing decisions.
Recovery nutrition timing optimization uses post-workout glucose patterns to guide meal timing. CGM reveals when glucose drops below baseline after exercise, indicating the ideal window for recovery nutrition. This personalized timing maximizes muscle glycogen replenishment while avoiding excessive glucose spikes.
Sleep quality correlation tracking connects previous day nutrition and activity with overnight glucose patterns. Logging meals, exercise timing, stress levels, and sleep quality allows correlation analysis over weeks. Users often discover that late-night eating, insufficient exercise, or high stress reliably predict poor overnight glucose control.
Stress response quantification makes psychological stress visible through glucose monitoring. When feeling stressed, check glucose levels even without eating. Many users discover that work stress, relationship conflicts, or financial worries raise glucose by 10-30 mg/dL through cortisol elevation. Testing stress reduction techniques shows which interventions effectively lower stress-induced glucose.
Supplement testing evaluates glucose impacts of herbs, vitamins, and other supplements. Some supplements like berberine and cinnamon claim to improve glucose control. Testing glucose before and after supplement use for several weeks reveals actual effects rather than relying on marketing claims. Research-supported supplements should show measurable improvements in glucose patterns.
Alcohol response testing reveals how different alcoholic beverages affect glucose. Some alcohol causes initial glucose elevation followed by delayed hypoglycemia. Testing different types and amounts of alcohol shows individual responses and helps establish safe consumption patterns that minimize glucose disruption.
Bottom line: Research demonstrates that identical meals produce glucose responses varying by 60 mg/dL or more between individuals, establishing that personalized food testing outperforms generic glycemic index guidelines. Systematic single-food testing identifies individual trigger foods causing spikes above 140 mg/dL or elevation lasting beyond 3 hours post-meal. Meal composition testing reveals macronutrient ratio effects, with protein and fat typically reducing glucose spikes by 15-40 mg/dL when combined with carbohydrates. Exercise timing testing shows post-meal walks reduce glucose spikes by 20-50 mg/dL when performed 15-30 minutes after eating, with optimal timing varying individually based on meal composition and digestion speed.
How Does CGM Technology Actually Measure Glucose Continuously?
The biosensor chemistry relies on glucose oxidase enzyme immobilized on an electrode surface. When glucose from interstitial fluid contacts the enzyme, it catalyzes the oxidation of glucose to gluconolactone. This reaction transfers electrons to the electrode, creating an electrical current proportional to glucose concentration.
The enzyme layer is covered by a biocompatible membrane that controls glucose and oxygen diffusion rates. This membrane blocks large molecules and cells from reaching the sensor while allowing glucose molecules to pass through. The membrane composition affects sensor accuracy, response time, and functional lifespan.
The electrochemical sensor generates a current typically in the nanoampere range. This tiny signal requires amplification and conversion to a digital value representing glucose concentration. Sophisticated algorithms compensate for factors like temperature, sensor aging, and tissue response that affect the glucose-current relationship.
Wireless transmission sends processed glucose values from the sensor transmitter to a smartphone or receiver. Most systems use Bluetooth Low Energy technology optimized for minimal power consumption, allowing sensors to operate for 10-14 days on small batteries. Some systems use near-field communication requiring the receiver to be held near the sensor to collect readings.
Sensor insertion depth affects measurement accuracy and sensor lifespan. Most CGM sensors insert 5-7mm under the skin into the subcutaneous tissue where interstitial fluid surrounds the sensor filament. Insertion too shallow risks sensor failure, while insertion too deep may cause discomfort without improving accuracy.
The foreign body response to sensor insertion creates temporary inflammation that affects accuracy during the first 12-24 hours. This is why most sensors require a warm-up period before providing readings. Research shows that accuracy improves after the initial inflammatory response subsides and a stable tissue interface forms around the sensor.
Calibration algorithms in factory-calibrated sensors use extensive population data to establish the relationship between electrical current and glucose concentration. Older systems required daily finger-stick calibrations, but modern sensors achieve acceptable accuracy without user calibration through improved manufacturing consistency and sophisticated algorithms.
Temperature compensation adjusts glucose readings for body temperature variations. The glucose oxidase enzyme reaction rate depends on temperature, so sensors include temperature measurement to compensate for this effect. Without compensation, normal body temperature fluctuations would cause apparent glucose changes that don’t reflect actual values.
Bottom line: CGM biosensors use glucose oxidase enzyme catalysis to generate electrical current proportional to glucose concentration in interstitial fluid. The sensor measures this current every 1-5 minutes, with algorithms compensating for temperature, tissue response, and sensor aging to produce glucose values transmitted wirelessly to display devices. Factory calibration using population data eliminates the need for daily finger-stick calibrations required by older systems, with modern sensors achieving clinical accuracy through improved manufacturing consistency and computational algorithms.
What Research Shows About CGM Benefits for Metabolic Health
Multiple studies demonstrate measurable improvements when non-diabetics use CGM for metabolic optimization. The 2025 systematic review of 23 studies with 1,074 participants found significant improvements in mean blood glucose levels when CGM was integrated into structured lifestyle programs. The effect sizes were largest in participants with prediabetes or elevated baseline glucose variability.
Research on behavioral change demonstrates that real-time biofeedback accelerates learning compared to delayed feedback. CGM provides immediate glucose responses within minutes of food consumption, creating clear cause-effect relationships. This immediacy strengthens behavior modification compared to laboratory blood tests taken days or weeks after dietary changes.
Studies on weight loss interventions show that CGM-guided programs achieve superior outcomes compared to calorie-counting alone. Research participants using CGM to minimize glucose spikes lost more weight and showed greater improvements in insulin sensitivity compared to matched controls following identical calorie restrictions without CGM feedback. The glucose-stabilizing dietary patterns naturally reduced appetite and increased satiety.
Athletic performance research reveals that glucose availability affects both endurance and high-intensity exercise capacity. A study on CGM-informed carbohydrate refueling demonstrated that real-time glucose monitoring allowed athletes to optimize fueling strategies during prolonged exercise, improving performance outcomes compared to traditional time-based refueling protocols. Studies using CGM during training demonstrated that athletes could optimize pre-workout carbohydrate timing to maximize performance while minimizing unnecessary glucose spikes during recovery periods. The data-driven approach replaced guesswork about fueling strategies.
Cardiovascular disease research establishes connections between glucose variability and arterial damage even in non-diabetic ranges. The systematic review on CGM for cardiovascular disease risk reduction found that reducing glucose variability through CGM-guided interventions improved endothelial function and reduced inflammatory markers in non-diabetic individuals with elevated cardiovascular risk. These changes appeared before traditional risk factors like LDL cholesterol showed improvement.
Sleep research demonstrates bidirectional relationships between glucose control and sleep quality. A scoping review of glucose spikes in non-diabetics analyzed patterns from continuous glucose monitoring studies and found that individuals without diabetes still experience significant glucose variability, with lifestyle factors like meal composition, sleep quality, and stress influencing spike frequency and magnitude. Poor sleep increases next-day glucose responses, while unstable overnight glucose disrupts sleep architecture. CGM studies show that stabilizing glucose through dietary changes improves sleep quality measurements including time in deep sleep and sleep efficiency percentages.
Stress management research reveals that psychological stress raises glucose through cortisol-mediated mechanisms. A comprehensive analysis of continuous glucose monitoring data from thousands of non-diabetic individuals characterized normal glucose patterns across diverse populations, establishing baseline metrics for healthy glucose variability, time-in-range, and postprandial responses that inform metabolic health optimization strategies. Studies using CGM during stress reduction interventions demonstrate that meditation, breathing exercises, and brief walks measurably lower stress-induced glucose elevation within minutes. This objective feedback enhances motivation for stress management practices.
Aging research suggests that glucose variability accelerates cellular aging through oxidative stress and advanced glycation end-product formation. Longitudinal studies show that individuals maintaining lower glucose variability show slower rates of age-related decline in multiple organ systems. CGM enables older adults to identify and minimize glucose variability despite age-related changes in glucose regulation.
Bottom line: The 2025 systematic review of 23 studies with 1,074 non-diabetic participants demonstrated significant improvements in mean blood glucose levels with CGM-guided lifestyle interventions, with largest effect sizes in prediabetic individuals. Research shows CGM-based weight loss programs achieve superior outcomes compared to calorie-counting alone, with participants showing greater reductions in body weight and improvements in insulin sensitivity. The 2026 cardiovascular systematic review found that reducing glucose variability through CGM guidance improved endothelial function and reduced inflammatory markers before traditional risk factors showed changes, establishing metabolic optimization as an early cardiovascular disease prevention strategy.
How to Interpret Your CGM Data - Practical Guide
Understanding the glucose curve shape provides more insight than individual numbers. A healthy response shows a gradual rise peaking at 120-140 mg/dL within 60-90 minutes, then a smooth return to baseline within 2-3 hours. Rapid spikes reaching 160+ mg/dL, delayed peaks occurring 2+ hours after eating, or inability to return to baseline indicate metabolic stress.
The area under the curve quantifies total glucose exposure from a meal. Two meals might produce identical peak values but dramatically different areas under the curve. A sharp spike returning quickly to baseline creates less total glucose exposure than a moderate elevation lasting 4 hours. Some apps calculate glucose area automatically.
Trend arrows indicate the direction and speed of glucose change. A single upward arrow means glucose is rising 1-2 mg/dL per minute. Double upward arrows indicate rapid rise at 2+ mg/dL per minute. Downward arrows show falling glucose. These arrows matter more than current values for real-time decisions about eating or exercise.
Baseline glucose variability throughout the day reveals overall metabolic stability. Calculate the standard deviation of your glucose readings over 24 hours. Values below 15 mg/dL indicate excellent stability. Standard deviation between 15-25 mg/dL shows moderate variability. Values above 25 mg/dL suggest excessive glucose fluctuation requiring dietary or lifestyle intervention.
Comparing fasting glucose to average glucose reveals the relative contribution of meals versus baseline dysregulation. If fasting glucose averages 85 mg/dL but average glucose runs 115 mg/dL, meals drive the elevation. If fasting glucose averages 100 mg/dL and average glucose is 105 mg/dL, baseline glucose regulation represents the primary issue requiring different interventions.
Bottom line: Healthy glucose responses show gradual rises peaking at 120-140 mg/dL within 60-90 minutes with smooth returns to baseline within 2-3 hours, while responses exceeding 160 mg/dL peak, delayed peaks beyond 90 minutes, or failure to reach baseline within 3 hours indicate metabolic stress requiring dietary modification. Glucose curve area under the curve quantifies total exposure beyond peak values alone. Standard deviation below 15 mg/dL over 24 hours indicates excellent metabolic stability, 15-25 mg/dL shows moderate variability, and values above 25 mg/dL suggest excessive fluctuation requiring intervention.
Complete Metabolic Health Monitoring System
Comprehensive metabolic optimization combines CGM with complementary tracking tools. Research demonstrates that glucose control represents one component of metabolic health rather than a complete picture. Integrating multiple data streams provides superior insights compared to glucose monitoring alone.
Activity tracking correlates movement with glucose responses. Wearable fitness devices record steps, exercise intensity, and calorie expenditure. Combining this data with CGM reveals how different activity types and timing affect glucose control. Some users discover that morning walks stabilize glucose all day, while others find evening exercise provides better overnight control.
Sleep monitoring identifies how sleep quality affects next-day glucose regulation. Research shows that poor sleep increases insulin resistance and glucose responses to identical meals the following day. Sleep trackers measuring duration, sleep stages, and disruptions combine with CGM to quantify this relationship individually.
Heart rate variability measurement assesses autonomic nervous system balance and stress levels. Research correlates low HRV with insulin resistance and poor glucose control. Tracking HRV alongside glucose patterns reveals whether stress reduction interventions improve both autonomic function and metabolic health simultaneously.
Body composition tracking monitors changes in lean mass and fat mass during metabolic optimization. Scale weight alone poorly reflects metabolic health changes. Someone gaining muscle while losing fat may see minimal weight change but dramatic improvements in glucose control and insulin sensitivity. Bioimpedance scales or DEXA scans provide this differentiation.
Blood pressure monitoring complements glucose tracking for cardiovascular risk assessment. Research shows that glucose variability and elevated postprandial glucose correlate with blood pressure dysregulation. Tracking both metrics reveals their interconnection and response to lifestyle interventions.
Ketone monitoring shows when glucose restriction triggers ketone production. Some people pursuing metabolic health use periodic fasting or very-low-carbohydrate diets. Blood or breath ketone measurements combined with CGM reveal the glucose level at which individual ketone production begins and intensifies.
The integration platform matters as much as individual devices. Some health apps aggregate data from multiple sources, creating a unified dashboard. Research on multimodal monitoring integration using differential absorbance and photoplethysmography demonstrated that combining multiple physiological signals through machine learning models improved glucose prediction accuracy compared to single-modality approaches.
Structured behavior change protocols provide the framework for using monitoring data effectively. Research shows that monitoring alone rarely produces sustained change without structured goal-setting, accountability systems, and progressive challenges. The most effective programs combine comprehensive monitoring with coaching, education, and social support.
Periodic monitoring maintains awareness without continuous tracking burden. Some research suggests that continuous year-round monitoring provides diminishing returns after initial behavior changes stabilize. Periodic 2-4 week monitoring sessions every few months may maintain awareness and identify metabolic drift more effectively than permanent monitoring that users begin to ignore.
Bottom line: Research on multimodal metabolic monitoring demonstrates that integrating CGM with activity tracking, sleep monitoring, heart rate variability measurement, body composition analysis, and blood pressure tracking provides superior metabolic health insights compared to glucose monitoring alone. Machine learning analysis of combined physiological signals improves glucose prediction accuracy beyond single-modality CGM. However, comprehensive monitoring requires structured behavior change protocols including goal-setting, coaching, and accountability to translate data into sustained metabolic improvements rather than information overload.
What Are the Limitations and Risks of CGM for Non-Diabetics?
Sensor insertion carries minimal but real risk of bleeding, bruising, infection, and allergic reaction to adhesive. Research on CGM complications in diabetes populations shows infection rates below 0.5% and allergic reactions in approximately 5-10% of users. Most reactions resolve by changing sensor locations or using barrier products under the adhesive.
The adhesive can cause skin irritation ranging from mild redness to contact dermatitis. Users with sensitive skin may develop itching, rash, or skin discoloration at sensor sites. Rotating sensor locations between available body areas minimizes cumulative skin stress. Some manufacturers offer adhesive patches with hypoallergenic properties for sensitive users.
Accuracy limitations create potential for misinterpretation. Even systems with 9-10% mean absolute relative difference show individual readings varying by 20-30 mg/dL from actual blood glucose. Non-diabetics unfamiliar with these limitations may overreact to temporarily elevated readings or miss true patterns by focusing on individual measurements rather than trends.
The interstitial lag during rapidly changing glucose can mislead users making real-time decisions. During intense exercise with rapidly falling glucose, the CGM may show values 20-30 mg/dL higher than actual blood glucose. An athlete stopping exercise due to CGM readings showing adequate glucose might actually be experiencing low blood sugar.
Over-reliance on technology can replace intuitive body awareness. Research suggests that constant monitoring may reduce attention to hunger, satiety, and energy level cues. Some users become anxious without numerical confirmation of their metabolic state, losing confidence in normal physiological feedback.
Obsessive monitoring behaviors emerge in some users, particularly those prone to health anxiety or eating disorders. The constant stream of glucose data can trigger excessive dietary restriction, compulsive food testing, or anxiety about normal glucose fluctuations. Mental health professionals caution against CGM use in individuals with eating disorder history without appropriate psychological support.
Cost represents a significant limitation for many potential users. CGM systems cost $75-150 per month for sensors plus device costs, totaling $900-1800 annually. Insurance rarely covers CGM for non-diabetics, making this an out-of-pocket expense that exceeds many people’s health budgets. This cost limits access to higher-income users, potentially increasing health disparities.
Data privacy concerns arise with continuous biological monitoring. CGM companies collect detailed glucose patterns, meal logs, activity data, and health information. Users should review privacy policies to understand data usage, third-party sharing, and retention practices before committing to a monitoring system.
Unclear evidence for long-term benefits in healthy individuals limits strong recommendations for universal CGM use. While research shows benefits in prediabetic and at-risk populations, evidence for metabolically healthy individuals remains limited. The 2025 systematic review found strongest benefits in participants with prediabetes, with less clear advantages in completely healthy populations.
Bottom line: Research shows CGM-related infection rates below 0.5% with adhesive allergic reactions in 5-10% of users, both manageable through site rotation and hypoallergenic products. The primary risks involve misinterpretation of accuracy limitations where individual readings may vary 20-30 mg/dL from actual blood glucose, obsessive monitoring behaviors particularly in users prone to health anxiety or eating disorders, annual costs of $900-1800 without insurance coverage creating access disparities, and data privacy concerns regarding continuous biological monitoring. The 2025 systematic review of 23 studies demonstrated strongest evidence for CGM benefits in prediabetic populations, with less clear advantages for metabolically healthy individuals.
Frequently Asked Questions
Can non-diabetics benefit from using a continuous glucose monitor?
Research shows CGMs help non-diabetics optimize metabolic health, identify food sensitivities, improve athletic performance, and detect early insulin resistance. The 2025 systematic review analyzed 23 studies with 1,074 non-diabetic participants across 11 countries and found that CGM use significantly improved mean blood glucose compared to controls. The strongest benefits appeared in individuals with prediabetes or elevated metabolic risk factors.
Non-diabetic athletes use CGM to optimize pre-workout nutrition timing, identify performance-enhancing foods, and avoid glucose crashes during competition. Weight management programs increasingly incorporate CGM to reveal which foods trigger cravings through glucose spikes and crashes.
How accurate are continuous glucose monitors compared to lab tests?
Modern CGMs show high accuracy compared to laboratory blood glucose measurements. Research on the FreeStyle Libre 2 system demonstrated mean absolute relative difference of 9.8% across 14 days of continuous monitoring in hospital settings. Dexcom systems achieve similar accuracy with MARD values below 9%.
These accuracy levels exceed FDA requirements for diabetes management devices and provide clinically relevant precision for non-diabetic metabolic health tracking. The 5-15 minute lag between interstitial fluid glucose and blood glucose creates timing differences during rapid changes but doesn’t affect overall measurement accuracy for pattern-based optimization.
What is a normal glucose range for non-diabetic individuals?
Research indicates healthy non-diabetics maintain fasting glucose between 70-99 mg/dL, with optimal values in the 75-85 mg/dL range. Postprandial peaks typically reach 120-140 mg/dL within 60-90 minutes after meals and return to baseline within 2-3 hours. Average 24-hour glucose in healthy individuals ranges from 79-100 mg/dL.
Time-in-range metrics show healthy individuals spend 70% or more of their time between 70-140 mg/dL. Values consistently above 140 mg/dL or failure to return to baseline between meals indicate early metabolic dysfunction, even when fasting blood tests remain normal.
Do I need a prescription to buy a CGM if I’m not diabetic?
Regulations vary by system and region. Abbott Lingo and Dexcom Stelo are available over-the-counter in the United States for non-diabetic wellness use without prescription. These systems were specifically designed for metabolic health tracking rather than diabetes management.
Traditional diabetes CGM systems like Dexcom G7, FreeStyle Libre 3, and Medtronic Guardian require prescriptions in most regions. Some non-diabetics obtain prescriptions from physicians who recognize the value of metabolic optimization. Telehealth services increasingly offer CGM prescriptions for wellness purposes.
Can CGM detect prediabetes before standard blood tests?
Yes. CGM reveals elevated postprandial glucose, prolonged glucose elevation, and high glucose variability that indicate early insulin resistance before fasting glucose becomes abnormal. Standard prediabetes diagnosis requires fasting glucose of 100-125 mg/dL or HbA1c of 5.7-6.4%, but metabolic dysfunction appears earlier.
Research found that significant percentages of non-diabetic individuals showed patterns associated with insulin resistance detectable through continuous glucose monitoring despite normal fasting blood tests. CGM identifies people with normal fasting glucose but elevated postprandial responses who show higher progression rates to prediabetes over subsequent years.
How long does each CGM sensor last?
Most CGM sensors last 10-14 days per application. Abbott Lingo sensors function for 14 days, Dexcom Stelo lasts 15 days, and traditional systems like FreeStyle Libre and Dexcom G7 last 10-14 days depending on the specific model. Some sensors may fail prematurely due to insertion issues, adhesive failure, or sensor errors.
Manufacturers typically replace defective sensors at no charge when failures occur before the rated lifespan. Proper skin preparation, careful insertion technique, and protective overtape can maximize sensor longevity and reduce premature failures.
What is the cost difference between CGM and finger-stick meters?
CGM systems cost approximately $75-150 per month for sensors, totaling $900-1800 annually. Most systems also require a one-time reader or transmitter purchase of $50-100, though many now work directly with smartphones eliminating this cost.
Quality finger-stick meters cost $15-40 for the device plus $0.25-0.50 per test strip. Someone testing 4 times daily spends approximately $30-60 per month on strips, or $360-720 annually. Strategic testing around meals and workouts reduces costs further while capturing key metabolic information.
How do I interpret my CGM data to make nutrition changes?
Start with systematic single-food testing. Eat a baseline meal that produces minimal glucose response, then test suspected trigger foods individually. Record the peak glucose, time to peak, and return to baseline for each food. Foods causing spikes above 140 mg/dL or elevation lasting more than 3 hours indicate poor metabolic matches.
Test meal composition by comparing identical carbohydrates eaten alone versus combined with protein and fat. Most people show 15-40 mg/dL lower glucose spikes when carbohydrates are consumed with protein and fat. Test meal timing by eating the same foods at different times of day. Many people maintain better glucose control eating larger meals earlier in the day.
Should I use CGM continuously or periodically?
Research evidence supports both approaches depending on goals and resources. Continuous year-round use provides ongoing feedback for maintaining metabolic optimization and quickly identifying dietary or lifestyle drift. This approach costs $900-1800 annually and works best for people with prediabetes, metabolic syndrome, or specific performance goals.
Periodic monitoring with 2-4 week sessions every few months maintains awareness while reducing costs and monitoring burden. This approach works well after initial behavior changes stabilize. Users conduct periodic check-ins to verify maintenance of healthy patterns and identify new optimization opportunities.
Related Reading
- Berberine vs Metformin for Blood Sugar Management - Compare natural and pharmaceutical approaches to glucose control
- Post-Workout Carb Timing for Muscle Glycogen Recovery - Optimize recovery nutrition timing with CGM data
- Natural vs Artificial Sweeteners Health Comparison - How different sweeteners affect glucose responses
- Does Intermittent Fasting Hurt Muscle Growth? - Fasted training effects on glucose and performance
- Sleep and Insomnia Supplements - Improve sleep quality to optimize glucose control
- Anxiety and Stress Management Supplements - Reduce stress-induced glucose elevation
- Protein Timing Myths and Optimal Intake Around Workouts - Meal timing strategies for performance
Research Summary: This article cites 11 peer-reviewed studies from PubMed examining continuous glucose monitoring accuracy, metabolic health applications, cardiovascular risk reduction, personalized nutrition responses, and multimodal monitoring integration. The research establishes that modern CGMs achieve 8-10% mean absolute relative difference from laboratory measurements, identify early metabolic dysfunction before standard blood tests show abnormalities, and provide actionable biofeedback for nutrition and exercise optimization in non-diabetic populations.